|
|
You are here: Foswiki>BunchBucket Web>BunchBucketDocumentation>BunchBucketDocuments>BunchBucketTestsMeasurements>BunchBucketTestMeasurement17 (16 Jan 2024, DietrichBeck)Edit Attach
December 2023: More Stability Tests
Table of ContentsIntroduction
Some data of the 2023 engineering run have been looked at in more detail.All (!) Phase Measurements at SIS18
Within a period of about four weeks, from 21 November to 20 December 2023, the phase difference measurements of all pattern executions at SIS18 have been compiled into a single data file. N.B.: The b2b system performs phase difference measurements not only for fast extraction but also for slow extraction. Thus, a vast amount of data of 740216 extractions is available for SIS18. The measured values are expected to form a distribution centered around 0 ns.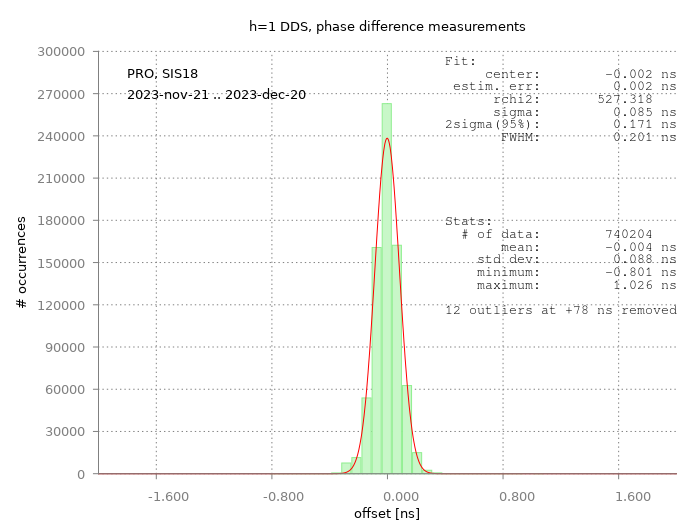 Figure: Measured h=1 group DDS phase differences for 740204 pattern executions at SIS18. The data is displayed as a histogram with 70 ps binwidth, to which a Gaussian is fitted. Basic statistics information is given on the lower right.
The results is displayed in the figure above. A small distribution with a FWHM about 200 ps, the standard deviation is about 88 ps. Both centers, Gaussian fit and mean value, only deviate from '0' in the low one-digit picoseconds range. Please note this includes data a multitude of different patterns used in operation at a broad range of different conditions (revolution frequency ...).
Only 12 measured values have been excluded from the data.
Figure: Measured h=1 group DDS phase differences for 740204 pattern executions at SIS18. The data is displayed as a histogram with 70 ps binwidth, to which a Gaussian is fitted. Basic statistics information is given on the lower right.
The results is displayed in the figure above. A small distribution with a FWHM about 200 ps, the standard deviation is about 88 ps. Both centers, Gaussian fit and mean value, only deviate from '0' in the low one-digit picoseconds range. Please note this includes data a multitude of different patterns used in operation at a broad range of different conditions (revolution frequency ...).
Only 12 measured values have been excluded from the data. - all 12 values have been measured on 22 November 2023 around 1500 UTC
- all 12 values are grouped around +78 ns
- all pattern (SIS18_FAST_HHD_IPM_TEST) executions are done at 1 Hz -> no 'data supply' between executions
- the calculated frequency shift for this pattern with a revolution frequency of 1050353.188555 Hz is about -5 Hz.
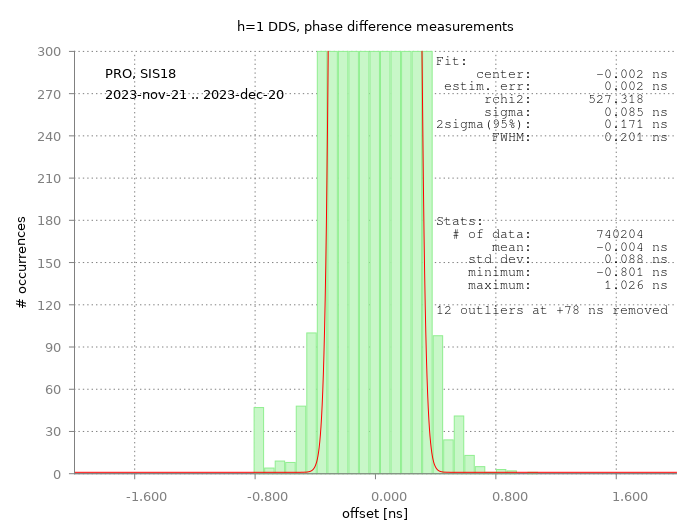 Figure: Measured h=1 group DDS phase differences for 740204 pattern executions. Identical to previous figure; only y-axis has been rescaled.
When the y-axis is scaled down by a factor of 1000, one can observe a slight broadening of the distribution at the bottom. See discussion on broadening for the example of CRYRING below.
Figure: Measured h=1 group DDS phase differences for 740204 pattern executions. Identical to previous figure; only y-axis has been rescaled.
When the y-axis is scaled down by a factor of 1000, one can observe a slight broadening of the distribution at the bottom. See discussion on broadening for the example of CRYRING below.
All (!) Phase Measurements at CRYRING
The observed width of the distribution depends on the number of samples used for the 'sub-nanoseconds fit', see here. The b2b system only has a limited time of about 80 us to perform the phase measurement. Usually, 30 samples are used. Thus, with frequencies below 400 kHz, the number of samples taken must be reduced. Below 50 kHz only two samples are taken. As SIS18 has a (h=1 DDS) revolution frequency of typically around 1 MHz, this is not an issue and 30 samples are for most pattern executions. But with the low energies at CRYRING, reducing the number of samples is a must. Compared to SIS18, the distribution observed at CRYRING is much broader, which can be seen in the figure below. Here are some data for CRYRING. Within the same period of four weeks as for SIS18, the data of all pattern executions of CRYRING have been compiled into a single file.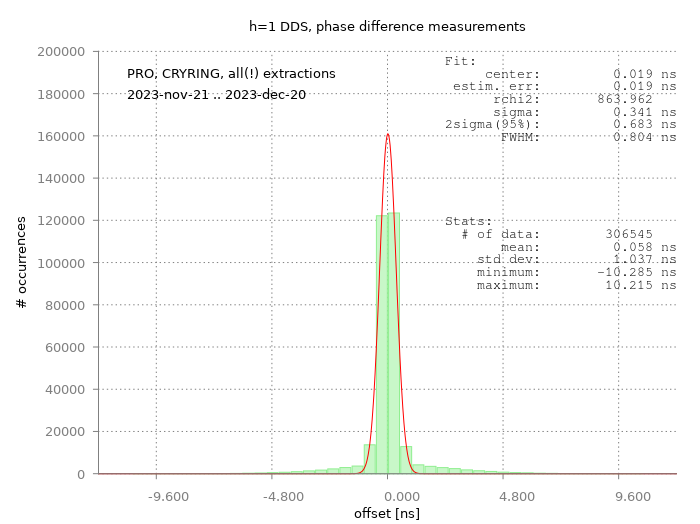 Figure: Measured h=1 group DDS phase differences for 306546 pattern executions at CRYRING. The data is displayed as a histogram with 501 ps binwidth, to which a Gaussian is fitted. Basic statistics information is given on the lower right.
The data has been taken with a various (h=1 DDS) revolution frequencies. The statistics information gives outliers up to +/- 10 ns. When looking into the data files, these large outliers are observed for low frequencies below 10 kHz (in words: single digit Kilohertz frequencies). The revolution frequency is in the acoustic range, well suited for the human ear! These low frequencies might be outside the specifications of the low-level RF system (?).
However, at CRYRING a jitter of 10 ns is nothing to worry about. With an rf-period of 100 us, an uncertainty of 10 ns corresponds to a relative precision of about 0.1 degree on the phase.
Figure: Measured h=1 group DDS phase differences for 306546 pattern executions at CRYRING. The data is displayed as a histogram with 501 ps binwidth, to which a Gaussian is fitted. Basic statistics information is given on the lower right.
The data has been taken with a various (h=1 DDS) revolution frequencies. The statistics information gives outliers up to +/- 10 ns. When looking into the data files, these large outliers are observed for low frequencies below 10 kHz (in words: single digit Kilohertz frequencies). The revolution frequency is in the acoustic range, well suited for the human ear! These low frequencies might be outside the specifications of the low-level RF system (?).
However, at CRYRING a jitter of 10 ns is nothing to worry about. With an rf-period of 100 us, an uncertainty of 10 ns corresponds to a relative precision of about 0.1 degree on the phase.
Length of SIS18 Extraction Kick
As a new feature of the b2b system, the measurement of the length of the kick pulse has been implemented by mid November 2023. At that time, first test measurements have been performed, click. These data are available for operations via the relevant 'app' as well as for off-line analysis. An example are data that have been taken for 4554 executions of patternSIS18_FAST_HHD_Setup_for_HADES on 27 November 2023, 1000-1200 UTC.
The measurement is very similar to this one. As the main difference, the falling edge of the magnet probe signal is time-stamped too and the time difference between rising and falling edge is calculated.
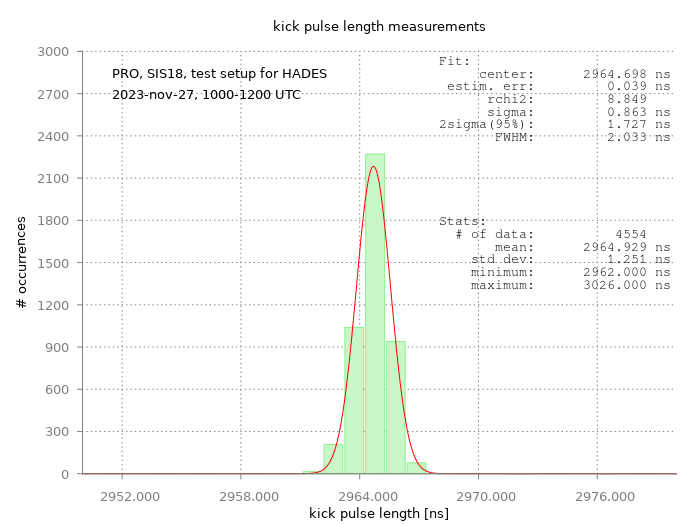 Figure: Measured kick pulse length at SIS18.
-- DietrichBeck - 16 Jan 2024
Figure: Measured kick pulse length at SIS18.
-- DietrichBeck - 16 Jan 2024


| I | Attachment | Action | Size | Date | Who | Comment |
|---|---|---|---|---|---|---|
| |
engrun_sis18_diagphase.png | manage | 44 K | 02 Jan 2024 - 14:30 | DietrichBeck | phase difference for many extraction from SIS18 |
| |
engrun_sis18_diagphase_zoom.png | manage | 47 K | 02 Jan 2024 - 15:01 | DietrichBeck | phase difference for many extraction from SIS18, zoomed |
| |
engrun_sis18_kicklen-hades.png | manage | 47 K | 02 Jan 2024 - 16:15 | DietrichBeck | |
| |
engrun_yr_diagphase.png | manage | 46 K | 02 Jan 2024 - 15:12 | DietrichBeck | phase difference for many extraction from CRYRING |
Edit | Attach | Print version | History: r3 < r2 < r1 | Backlinks | View wiki text | Edit wiki text | More topic actions
Topic revision: r3 - 16 Jan 2024, DietrichBeck
- Toolbox
-
 Create New Topic
-
 Index
Index
-
 Search
-
 Changes
-
 Notifications
-
 RSS Feed
-
 Statistics
-
 Preferences
Ideas, requests, problems regarding Foswiki? Send feedback