|
|
You are here: Foswiki>BunchBucket Web>BunchBucketDocumentation>BunchBucketDocuments>BunchBucketTestsMeasurements>BunchBucketTestMeasurement16 (22 Dec 2023, DietrichBeck)Edit Attach
November 2023: Testing Stability at SIS18 Extraction
Table of ContentsTL;DR
Test on 9 November 2023. Seems to work.Introduction
The data presented here have been taken during a test experiment at PRIOR with fast extraction from SIS18. The data have been analyzed to check the reliability of the bunch-2-bucket system.Measurements and Data
Testing the kicker was done at the following settings- pattern
SIS18_FAST_HHT_20231107_175831 - dry beam of carbon 6+ @ 230 MeV / u
- at extraction: 1.207 kHz revolution frequency, T_rev is 828 ns
- ParamModi values
- 'kick offset' 2.0 us
- kicker deflection 6.0 mrad
- Sequence ID 9
- time (UTC)
- 08-Nov-2023_12:35:58.584, begin
- 09-Nov-2023_05:04:57.223, end
- the SIS18 pattern was executed 1342 times
Analysis and Results
The archived data contains a multitude of data. For analysis the data is plotted as an histogram of which simple statistical information is calculated. Moreover, the histogram is fitted with a Gaussian. Here, the following the information was extracted.Phase Difference
The b2b performs two phase measurements at the extraction flat top. The first one at the beginning of the flat top serves to calculate the time for extraction. The second one is done at the end of the flat top. In the ideal world, the time difference between the two equals an integer number of h=1 DDS rf-periods. The deviation from a non-integer multiple is a (small) phase difference. Under the assumption, that the DDS outputs a clock signal with constant frequency at its set-value, the observation of a non-zero phase difference indicated a malfunction of the b2b system (click).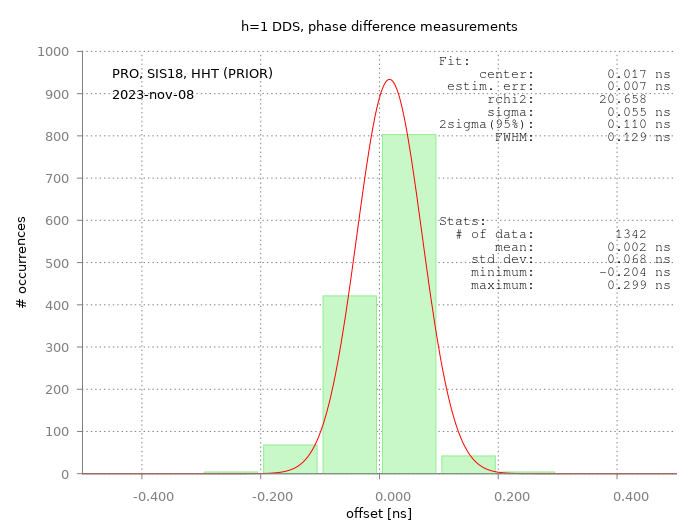 Figure: Measured group DDS phase differences for 1342 pattern executions. The data is displayed as a histogram with 100 ps binwidth, to which a Gaussian is fitted. Basic statistics information is given on the lower right.
The figure above shows a histogram of the measured phase differences for 1342 pattern executions. The Gaussian curve does not fit well, as the distribution is slightly asymmetric and consists of very few bins only. The statistics information on the lower right is more meaningful.
Figure: Measured group DDS phase differences for 1342 pattern executions. The data is displayed as a histogram with 100 ps binwidth, to which a Gaussian is fitted. Basic statistics information is given on the lower right.
The figure above shows a histogram of the measured phase differences for 1342 pattern executions. The Gaussian curve does not fit well, as the distribution is slightly asymmetric and consists of very few bins only. The statistics information on the lower right is more meaningful. - the phase difference measurement succeeded for all of the 1342 pattern executions, no 'faulty shots'
- the mean of the distribution is only 2 ps off-center
- the standard deviation is about 68 ps
- most importantly, the extremes of the distribution are at -203 ps / +299 ps
DDS Frequency
Another way to look at the same data is to turn things around. Here, it is assumed that the b2b system works perfectly. Then, one can use the measured phase difference to calculate actual value of the clock signals frequency delivered by the h=1 group DDS.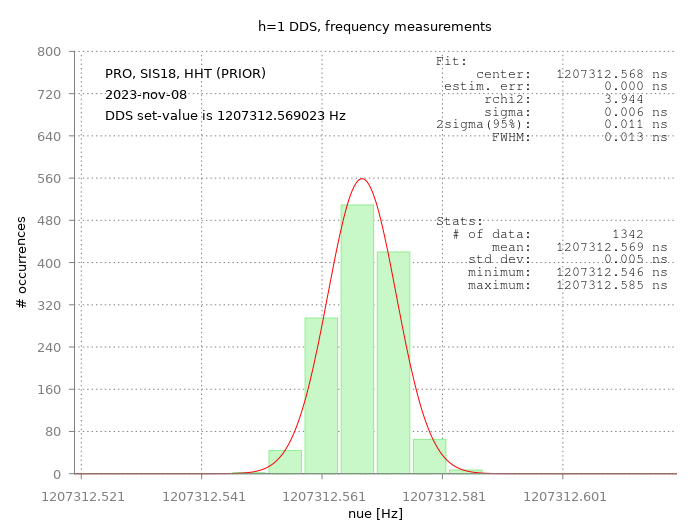 Figure: Measured group DDS frequency distribution. The data is displayed as a histogram with 6 mHz binwidth to which a Gaussian is fitted. Statics information at the lower right.
The figure above shows measured distribution of the measured frequency values. Both frequency values for the center, fit and mean of distribution, are consistent with the set-value. It should be noted, that the standard deviation is only 5 mHz, thus a relative precision of 4e-9 is achieved.
An example for bad agreement is shown below.
Figure: Measured group DDS frequency distribution. The data is displayed as a histogram with 6 mHz binwidth to which a Gaussian is fitted. Statics information at the lower right.
The figure above shows measured distribution of the measured frequency values. Both frequency values for the center, fit and mean of distribution, are consistent with the set-value. It should be noted, that the standard deviation is only 5 mHz, thus a relative precision of 4e-9 is achieved.
An example for bad agreement is shown below.
Kicker Magnet Probe Signal
When the b2b system triggers the kicker electronics and the kicker is fired, a probe at the kicker magnet picks up a signal of the kickers magnetic field. At SIS18 and ESR, a capacitive pickup is implemented that produces a precise electronic signals at the rising and falling magnetic field (click). The b2b system uses a comparator for very fast timestamping of the rising edge of that signal and further distribution via the White Rabbit network in hard real-time. Here, the information is delivered at the users Timing Receiver nodes via the White Rabbit network already 1 ms after the kick. This is achieved by timestamping the LVTTL signal at the output of the comparator and broadcasting that timestamp as a 'timing message' to the network, where it is transmitted in hard realtime with upper bound latency.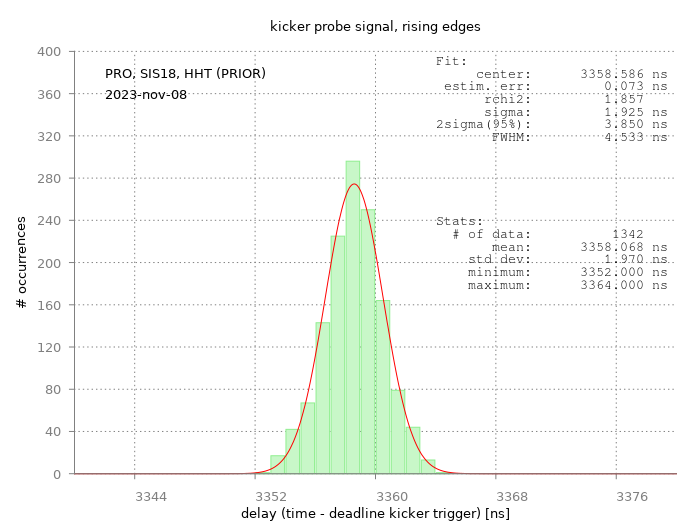 Figure: Measured time distribution of the rising edge of the kicker probe signal; binwidth is 1 ns. The x-axis shows the delay of the signal following the trigger Event of the b2b system.
The measured data of the kicker magnet probe signal includes a long chain of activity.
Figure: Measured time distribution of the rising edge of the kicker probe signal; binwidth is 1 ns. The x-axis shows the delay of the signal following the trigger Event of the b2b system.
The measured data of the kicker magnet probe signal includes a long chain of activity. - the b2b triggers the kicker eletronics with a LVTTL pulse
- the kicker electronics waits for a specified delay 'kicker offset'
- the kicker electronics fires the electron tubes of the kicker
- the energy stored in the 'big' cables is discharged
- the current is guided via ~80 m long cables to the kicker magnets
- a magnet field is created at the kicker magnets
- a magnetic probe picks up a signal of the magnetic field
- a capacitive coupler at the kicker magnet creates a fast electric signal
- the electric signal is guided back to the kicker room (~ 80 m)
- (the b2b system is connected to the signal of kicker module 1)
- the comparator of the b2b signal converts the signal to a clean LVTTL pulse
- the LVTTL pulse is fed into the timing receiver where the rising edge of the pulse is timestamped by the White Rabbit clock.
- (further processing and distribution of the data)
Conclusion
The stability of the system was tested during the PRIOR Experiment on 8-9 November 2023. The RRF system including BuTiS, the White Rabbit Timing system including b2b as well as the SIS18 extraction kicker worked reliably without issues.Bonus: Frequency with Free-Running DDS
This is not a measurement from production but from the integration system. As described above, the measurement of the DDS phase difference can be used to calculate the actual frequency of the DDS. Single frequency measurements by the b2b system achieve typically a one-digit millihertz precision. As BuTiS and White Rabbit are locked to each other, the measured frequency values usually match the LSA values perfectly. However, a very pronounced mismatch can be observed in case of failures. An example is shown in the figure below.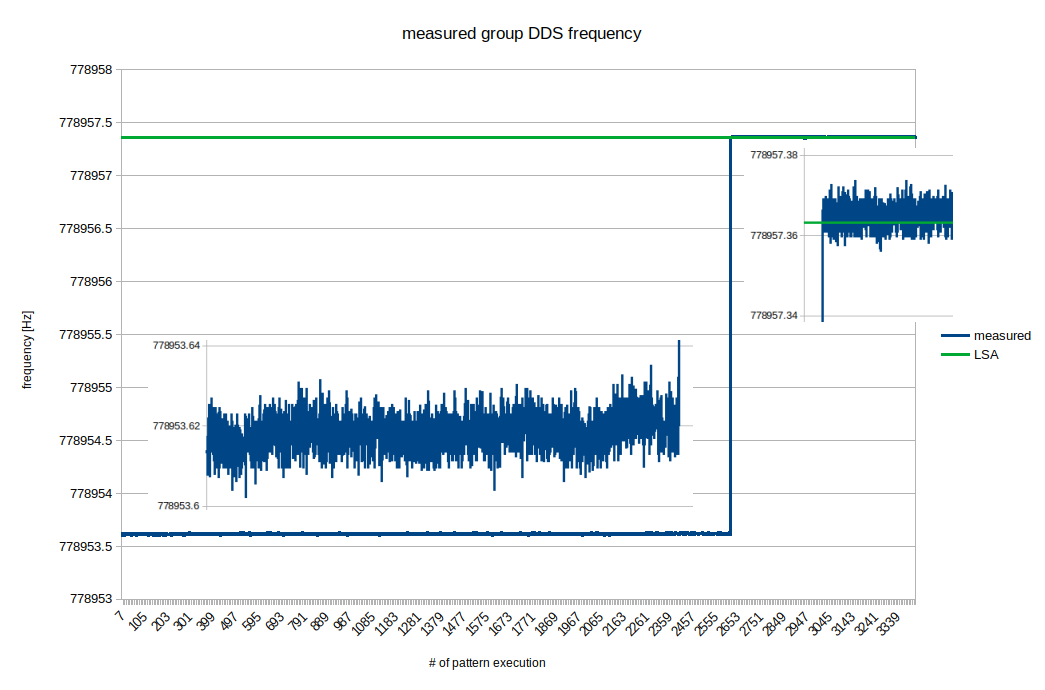 Figure: Measured DDS frequency vs. time. The insets show a zoom into a 40 mHz frequency range with DDS unlocked (left) and DDS locked (right). The statistical uncertainty for each measurement point is about 5 mHz. The green line indicates the set-value by LSA. Details see text.
Shown in the figure above are values of single frequency measurements over about 1.5 hours. The data stem from the integration system. As an observation, the measured frequency values deviate by almost 3.8 Hz from the LSA value. An analysis revealed that the group DDS was operated 'free-running' on its local clock due to an issue with the local clock distribution box ('lokaler Clockverteiler'). After a restart of the clock distribution box around pattern execution #2650, the clock chain from BuTiS to the DDS was reestablished and the measured frequency values are again in good agreement.
A closer look at the inset on the right indicates that the average measured values are slightly (~ 2 mHz) too high. As the phase difference is calculated from two different measurements 15.9 ms apart (the length of the flattop is 16.0 ms), this corresponds to deviation of the measured phase difference of about 30 ps only. Such a deviation is understood and might occur if the rf-phase at the beginning of the flat top is identical for all pattern executions (click). For the LSA value of the rf-period of this measurement, the simple model for the sub-ns fit predicts a systematic maximum deviation from the true value of about 40 ps.
-- DietrichBeck - 22 Dec 2023
Figure: Measured DDS frequency vs. time. The insets show a zoom into a 40 mHz frequency range with DDS unlocked (left) and DDS locked (right). The statistical uncertainty for each measurement point is about 5 mHz. The green line indicates the set-value by LSA. Details see text.
Shown in the figure above are values of single frequency measurements over about 1.5 hours. The data stem from the integration system. As an observation, the measured frequency values deviate by almost 3.8 Hz from the LSA value. An analysis revealed that the group DDS was operated 'free-running' on its local clock due to an issue with the local clock distribution box ('lokaler Clockverteiler'). After a restart of the clock distribution box around pattern execution #2650, the clock chain from BuTiS to the DDS was reestablished and the measured frequency values are again in good agreement.
A closer look at the inset on the right indicates that the average measured values are slightly (~ 2 mHz) too high. As the phase difference is calculated from two different measurements 15.9 ms apart (the length of the flattop is 16.0 ms), this corresponds to deviation of the measured phase difference of about 30 ps only. Such a deviation is understood and might occur if the rf-phase at the beginning of the flat top is identical for all pattern executions (click). For the LSA value of the rf-period of this measurement, the simple model for the sub-ns fit predicts a systematic maximum deviation from the true value of about 40 ps.
-- DietrichBeck - 22 Dec 2023


| I | Attachment | Action | Size | Date | Who | Comment |
|---|---|---|---|---|---|---|
| |
DDS-unlocked-locked.png | manage | 56 K | 22 Dec 2023 - 10:10 | DietrichBeck | DDS unlocked vs locked |
| |
prior_frequency.png | manage | 50 K | 20 Dec 2023 - 12:28 | DietrichBeck | frequency, prior |
| |
prior_kicker.png | manage | 48 K | 20 Dec 2023 - 12:28 | DietrichBeck | |
| |
prior_phase.png | manage | 46 K | 22 Dec 2023 - 10:10 | DietrichBeck | phase difference, prior |
Edit | Attach | Print version | History: r5 < r4 < r3 < r2 | Backlinks | View wiki text | Edit wiki text | More topic actions
Topic revision: r5 - 22 Dec 2023, DietrichBeck
- Toolbox
-
 Create New Topic
-
 Index
Index
-
 Search
-
 Changes
-
 Notifications
-
 RSS Feed
-
 Statistics
-
 Preferences
Ideas, requests, problems regarding Foswiki? Send feedback