|
|
You are here: Foswiki>BunchBucket Web>BunchBucketDocumentation>BunchBucketDocuments>BunchBucketTestsMeasurements>BunchBucketTestMeasurement7 (04 Nov 2021, DietrichBeck)Edit Attach
May 2021: Test Operation and First Real Bunch-to-Bucket SIS18 -> ESR
Table of ContentsIntroduction
The bunch-to-bucket transfer system has been used for almost one week in operation. From 11-16 May the focus has been on beam operation to experiments. The planned bunch-to-bucket experiment took place on 17 May.Setup
See here. B2B v00.02.40, branch b2b_dietrich_2020-oct-26, commit 4de28554Log
| date | Olog time | what | remark |
|---|---|---|---|
| 2021-05-11 | 08:30 | SIS18 and ESR kicker trigger changed from 'Timing Generator' to b2b system | |
| 09:00 | first beam extracted from SIS18 with b2b system | ||
| 15:00 | HKR: can't trigger BI equipment properly, see olog | see here | |
| the problem is, that B2B triggers extraction ~1ms after EVT_KICK_START, but the integration window of BI ends ~500us after EVT_KICK_START | |||
| 16:30 | solution: apply correction of -600 us for both extraction (SIS18) and injection (ESR) kickers at the b2b system | ||
| til 2021-05-17 | 08:00 | 6 days of routine operation with krypton beam SIS18 -> ESR (bunch to coasting beam), experiment at ESR | no issues, users are happy |
| til 2021-05-18 | 08:00 | 7 days of routine operation with xenon beam to HHT (fast extraction) experiment with PHELIX | no issues, users are happy |
| first synchronization of a plasma physics experiment with an extracted bunch to 1 ns | |||
| 2021-05-17 | 14:30 | setup ESR with xenon beam; begin injection as coasting beam | Sequence ID 1, 124Xe46+ @SIS18, stripper foil, 124Xe54+ @ESR |
| 16:00 | switch to mode buncht-to-bucket; but SIS18 has h=1 and ESR h=2; this does not fit! | ||
| 16:35 | no beam in ESR | ||
| 17:00 | one of the injection kicker modules at ESR failed, work with remaining two modules at higher energy | ||
| 17:20 | SIS18 changed to h=2 and ESR to h=1 (a bit dirty) | ||
| set revolution frequency in SIS18: cavity DDS 1979732.979 Hz (506.118 ns) | |||
| measured revolution frequency in ESR: cavity DDS 1975118.183 Hz (506.3 ns), T_beat 216.7 us | |||
| 17:45 | begin bunch-to-bucket test ' | ||
| 18:45 | end bunch-to-bucket test (experimentalists urgently need to enter ESR) |
Routine Operation
The bunch-to-bucket transfer system has been used for routine operation serving two different experiment for about 6 days.- krypton beam SIS18 -> ESR (as coasting beam)
- xenon beam with fast extraction to cave HHT (PHELIX)
- it is not straight forward to trigger on event numbers other than EVT_KICK_START1/2
- it is not possible to do pre- or post-triggering
Measurements with Bunch-to-Bucket Transfer
| UTC | phase difference [ns] | phase difference [degree] | cavity gap | remark |
|---|---|---|---|---|
| 16:00:23.693 | 272 | 193.4 | 650 | |
| 16:00:55.989 | 147 | 104.5 | 650 | |
| 16:01:28.280 | 147 | 104.5 | 650 | |
| 16:02:00.568 | 147 | 104.5 | 650 | |
| 16:02:32.861 | 397 | 282.3 | 650 | |
| 16:03:05.150 | 357 | 253.8 | 650 | |
| 16:03:37.439 | 317 | 225.4 | 650 | |
| 16:04:09.728 | 437 | 310.7 | 650 | |
| 16:04:42.030 | 437 | 310.7 | 650 | |
| 16:05:14.328 | 417 | 296.5 | 650 | |
| 16:05:46.628 | 417 | 296.5 | 650 | |
| 16:06:18.319 | 397 | 282.3 | 650 | |
| 16:06:50.617 | 397 | 282.3 | 650 | |
| 16:07:22.921 | 387 | 275.2 | 650 | |
| 16:07:55.233 | 387 | 275.2 | 650 | |
| 16:08:27.373 | 387 | 275.2 | 650 | |
| 16:08:58.921 | 387 | 275.2 | 650 | |
| 16:09:31.075 | 387 | 275.2 | 650 | |
| 16:10:03.203 | 387 | 275.2 | 650 | |
| 16:10:35.335 | 640 | 95.1 | 650 | |
| 16:11:07.464 | 640 | 95.1 | 650 | |
| 16:11:39.614 | 640 | 95.1 | 650 | |
| 16:12:11.738 | 630 | 88.0 | 650 | |
| 16:12:43.872 | 630 | 88.0 | 650 | |
| 16:13:15.444 | 620 | 80.8 | 650 | |
| 16:13:47.576 | 650 | 102.2 | 650 | |
| 16:14:19.704 | 660 | 109.3 | 650 | phase max destructive |
| 16:14:51.830 | 660 | 109.3 | 650 | |
| 16:15:23.993 | 660 | 109.3 | 650 | |
| 16:15:55.572 | 407 | 289.4 | 650 | phase optimal (destructive – 180 degree) |
| 16:16:27.752 | 407 | 289.4 | 650 | |
| 16:17:00.062 | 407 | 289.4 | 650 | |
| 16:17:32.237 | 407 | 289.4 | 650 | |
| 16:18:03.945 | 660 | 109.3 | 650 | |
| 16:18:36.085 | 407 | 289.4 | 650 | |
| 16:19:08.202 | 407 | 289.4 | 650 | |
| 16:19:40.350 | 407 | 289.4 | 650 | |
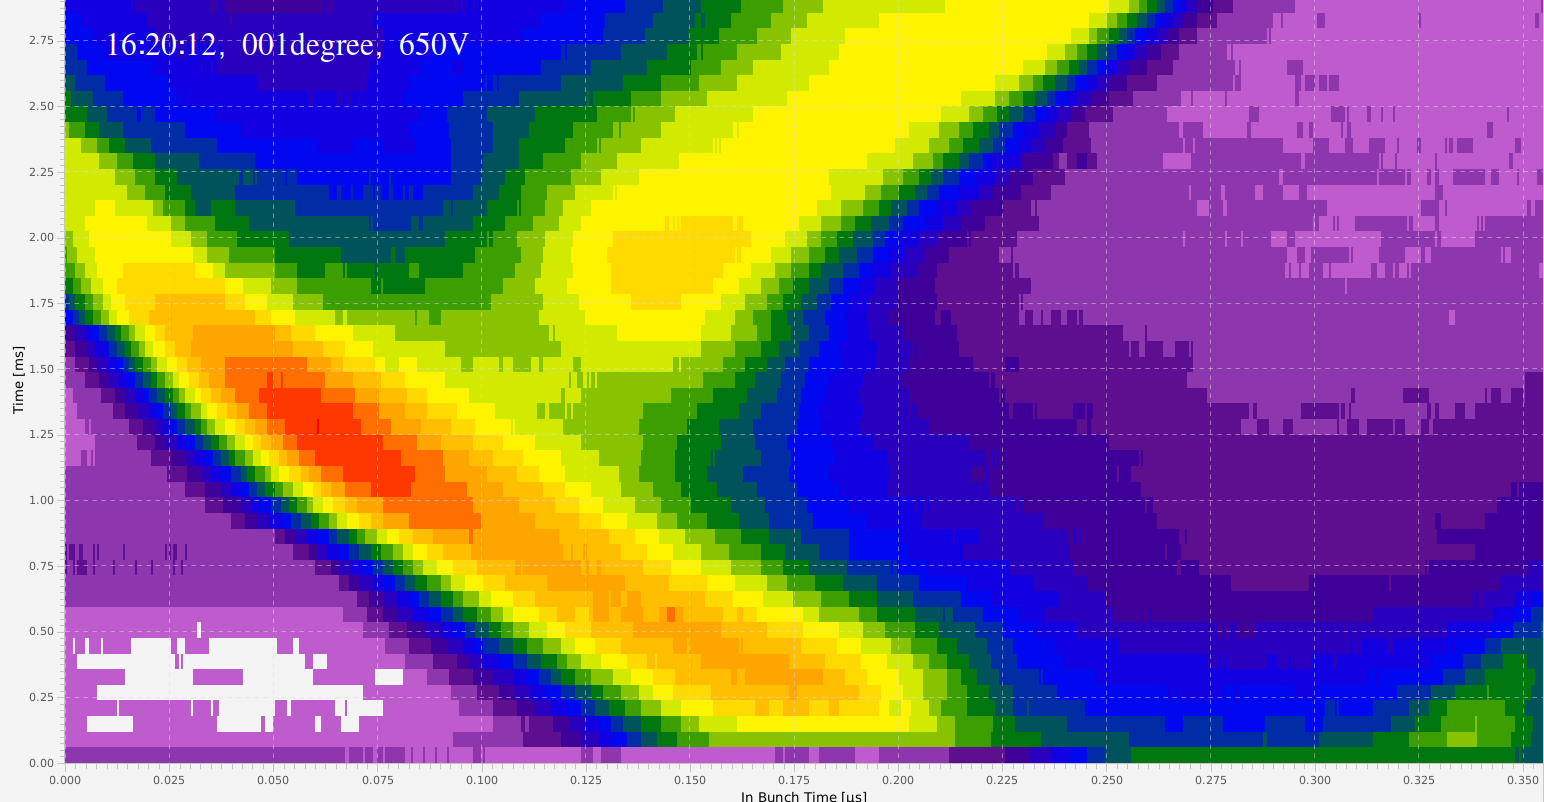
| 16:20:12.480 | 507 | 0.5 | 650 | |
| 16:20:44.612 | 507 | 0.5 | 650 | |
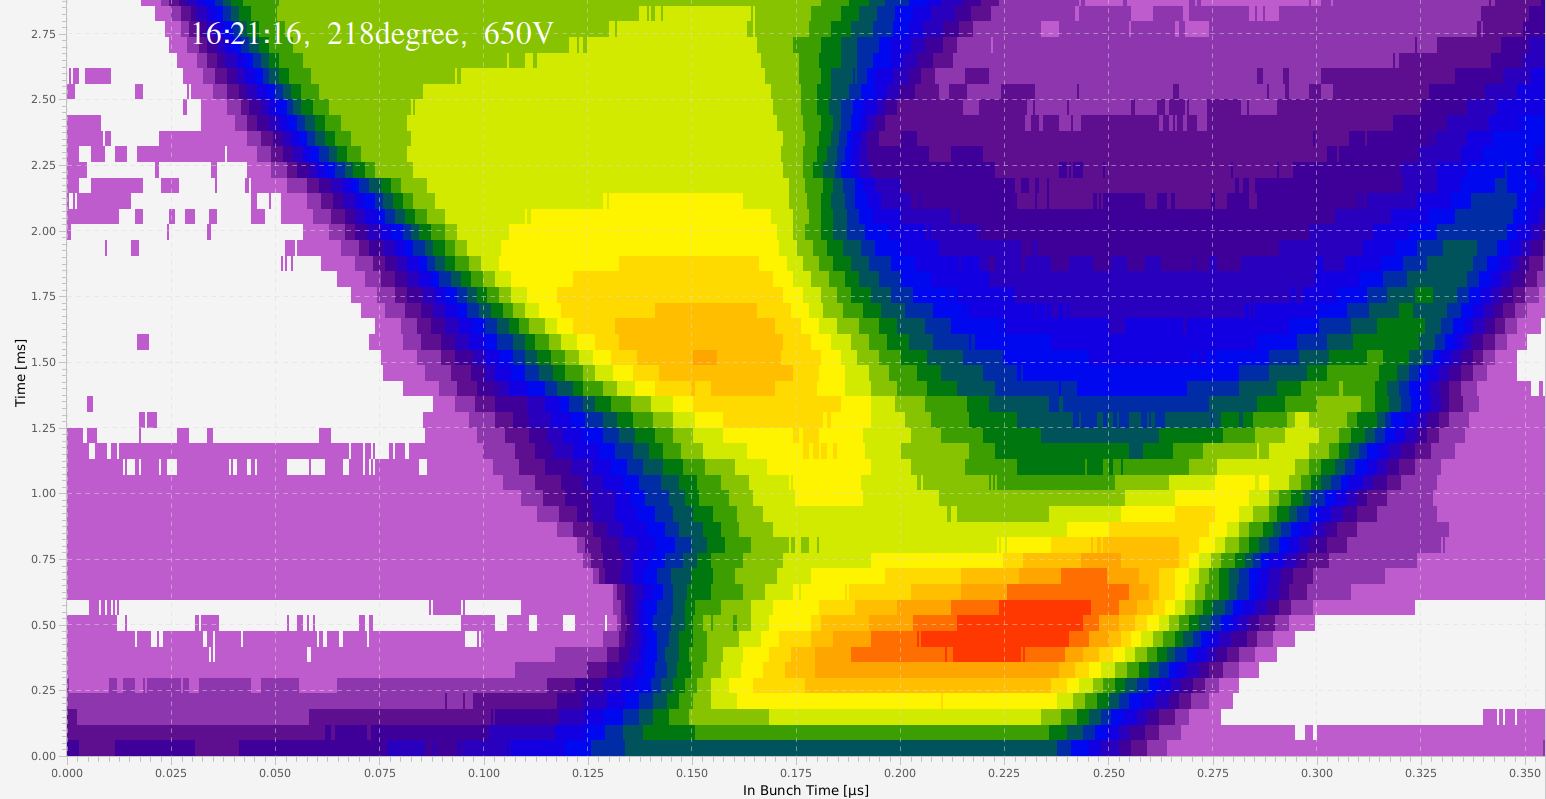
| 16:21:16.745 | 307 | 218.3 | 650 | |
| 16:21:48.881 | 307 | 218.3 | 650 | |
| 16:22:21.017 | 407 | 289.4 | 650 | |
| 16:22:53.175 | 407 | 289.4 | 650 | |
| 16:23:25.302 | 407 | 289.4 | 650 | |
| 16:23:57.453 | 407 | 289.4 | 650 | |
| 16:24:29.592 | 407 | 289.4 | 650 | |
| 16:25:01.725 | 407 | 289.4 | 650 | |
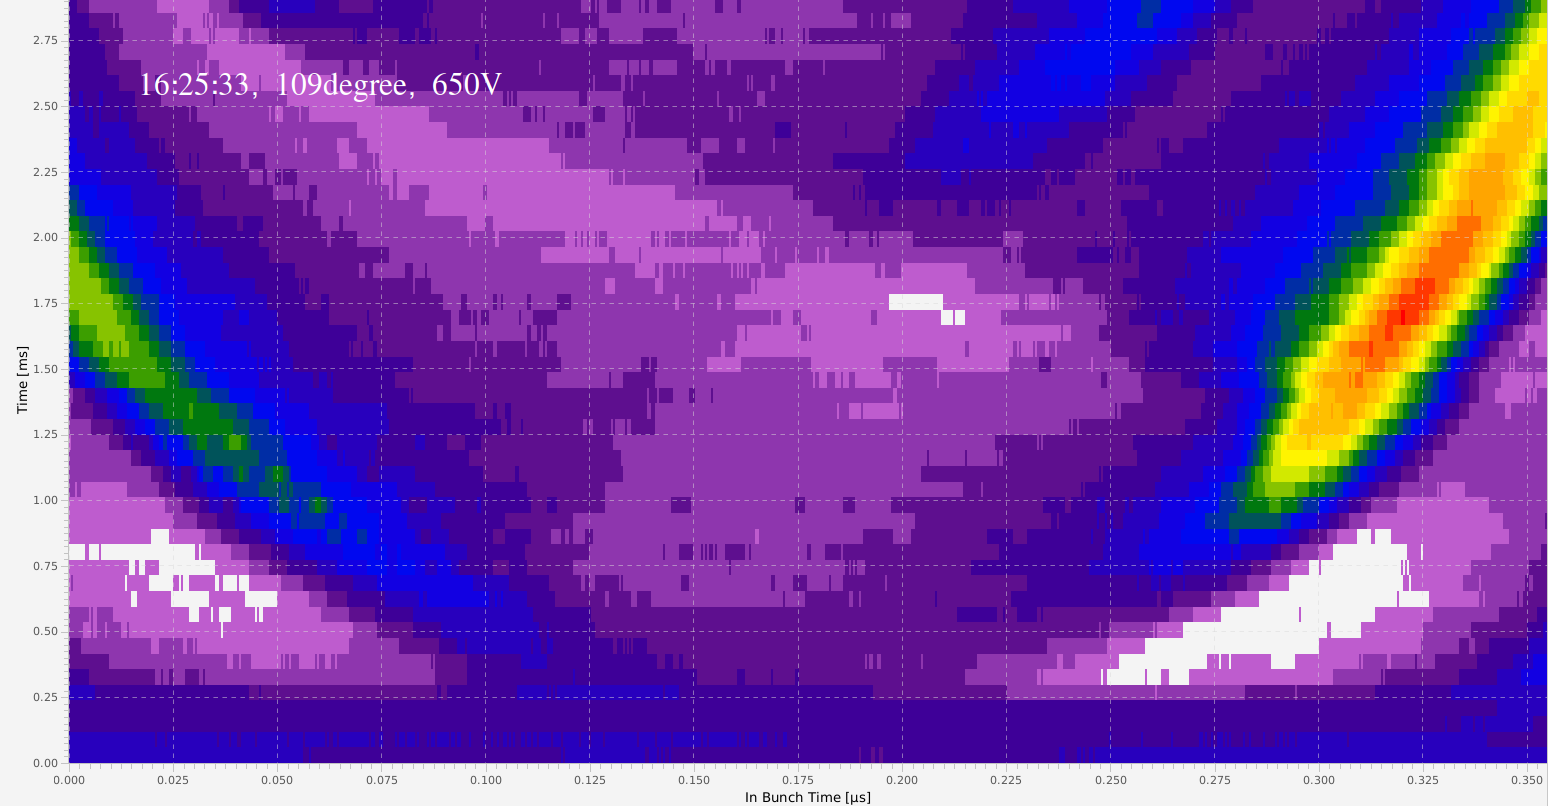
| 16:25:33.865 | 154 | 109.5 | 650 | |
| 16:26:06.008 | 154 | 109.5 | 650 | |
| 16:26:38.152 | 154 | 109.5 | 650 | |
| 16:27:10.319 | 154 | 109.5 | 650 | |
| 16:27:42.470 | 407 | 289.4 | 650 | |
| 16:28:14.632 | 407 | 289.4 | 650 | |
| 16:28:46.781 | 407 | 289.4 | 650 | |
| 16:29:18.931 | 407 | 289.4 | 650 | |
| 16:29:51.082 | 407 | 289.4 | 650 | |
| 16:30:23.233 | 407 | 289.4 | 650 | |
| 16:30:55.372 | 407 | 289.4 | 650 | |
| 16:31:27.531 | 407 | 289.4 | 650 | |
| 16:31:59.677 | 407 | 289.4 | 650 | |
| 16:32:31.844 | 407 | 289.4 | 650 | changing gap voltage @optimal phase |
| 16:33:03.408 | 407 | 289.4 | 163 | |
| 16:33:35.553 | 407 | 289.4 | 163 | |
| 16:34:07.714 | 407 | 289.4 | 163 | |
| 16:34:39.855 | 407 | 289.4 | 163 | |
| 16:35:11.998 | 407 | 289.4 | 163 | |
| 16:35:44.145 | 407 | 289.4 | 163 | |
| 16:36:16.310 | 407 | 289.4 | 163 | |
| 16:36:48.449 | 407 | 289.4 | 163 | |
| 16:37:20.584 | 407 | 289.4 | 163 | |
| 16:37:52.719 | 407 | 289.4 | 163 | |
| 16:38:24.878 | 407 | 289.4 | 163 | |
| 16:38:57.012 | 407 | 289.4 | 1281 | |
| 16:39:28.570 | 407 | 289.4 | 1281 | |
| 16:40:00.732 | 407 | 289.4 | 1281 | |
| 16:40:32.894 | 407 | 289.4 | 1281 | |
| 16:41:05.036 | 407 | 289.4 | 1281 | |
| 16:41:37.203 | 407 | 289.4 | 320 | |
| 16:42:09.351 | 407 | 289.4 | 320 | |
| 16:42:41.493 | 407 | 289.4 | 320 | |
| 16:43:13.636 | 154 | 109.5 | 320 | phase destructive (optimal – 180 degree) |
| 16:43:45.782 | 154 | 109.5 | 320 | |
| 16:44:17.928 | 154 | 109.5 | 320 | |
| 16:44:50.088 | 407 | 289.4 | 320 | phase optimal again |
| 16:45:22.223 | 407 | 289.4 | 320 | |
| 16:45:54.382 | 407 | 289.4 | 320 | |
| 16:46:26.525 | 407 | 289.4 | 320 | |
| 16:46:58.665 | 407 | 289.4 | 320 | |
| 16:47:30.798 | 407 | 289.4 | 320 | |
| 16:48:02.932 | 407 | 289.4 | 320 |


RF-Phase Difference
Injection as Function of Phase Difference
 Figure: 218 degree phase difference.
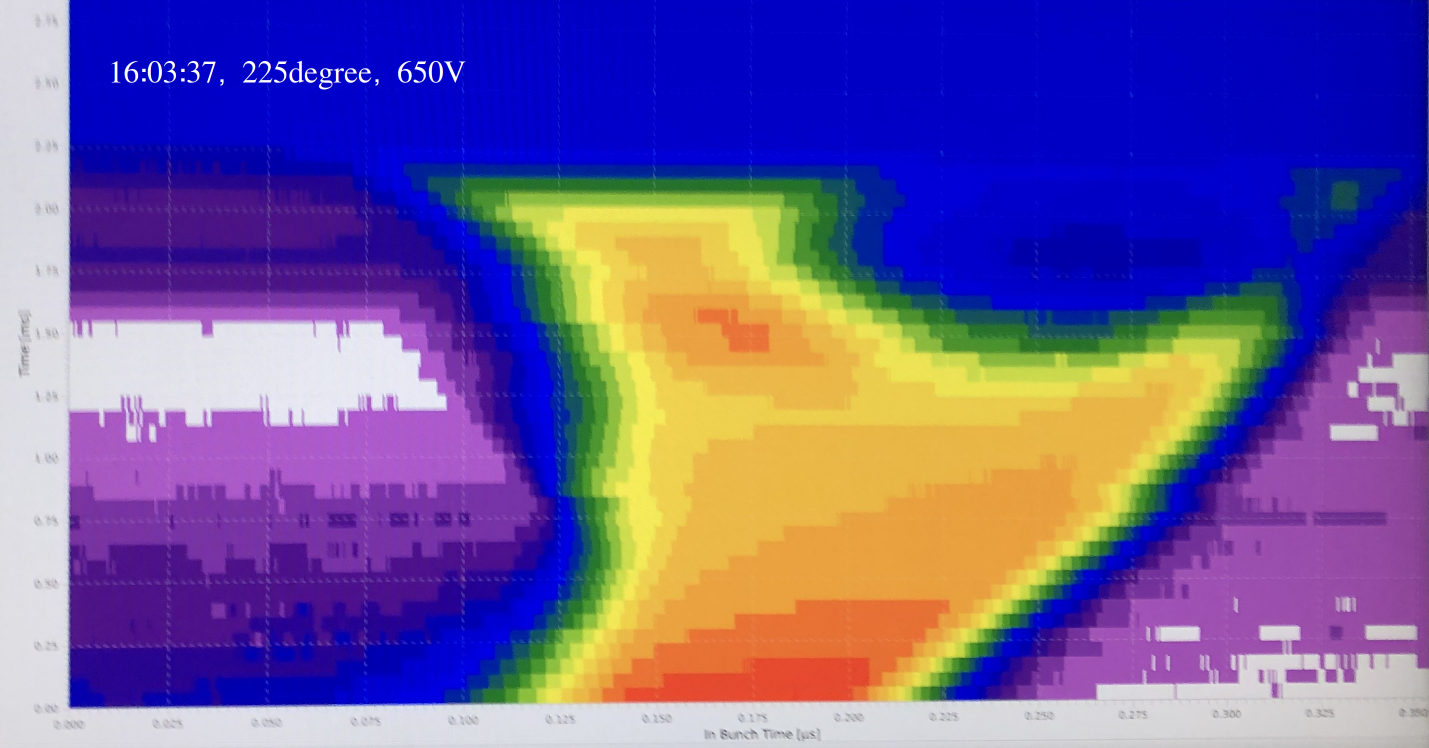 Figure: 225 degree phase difference.
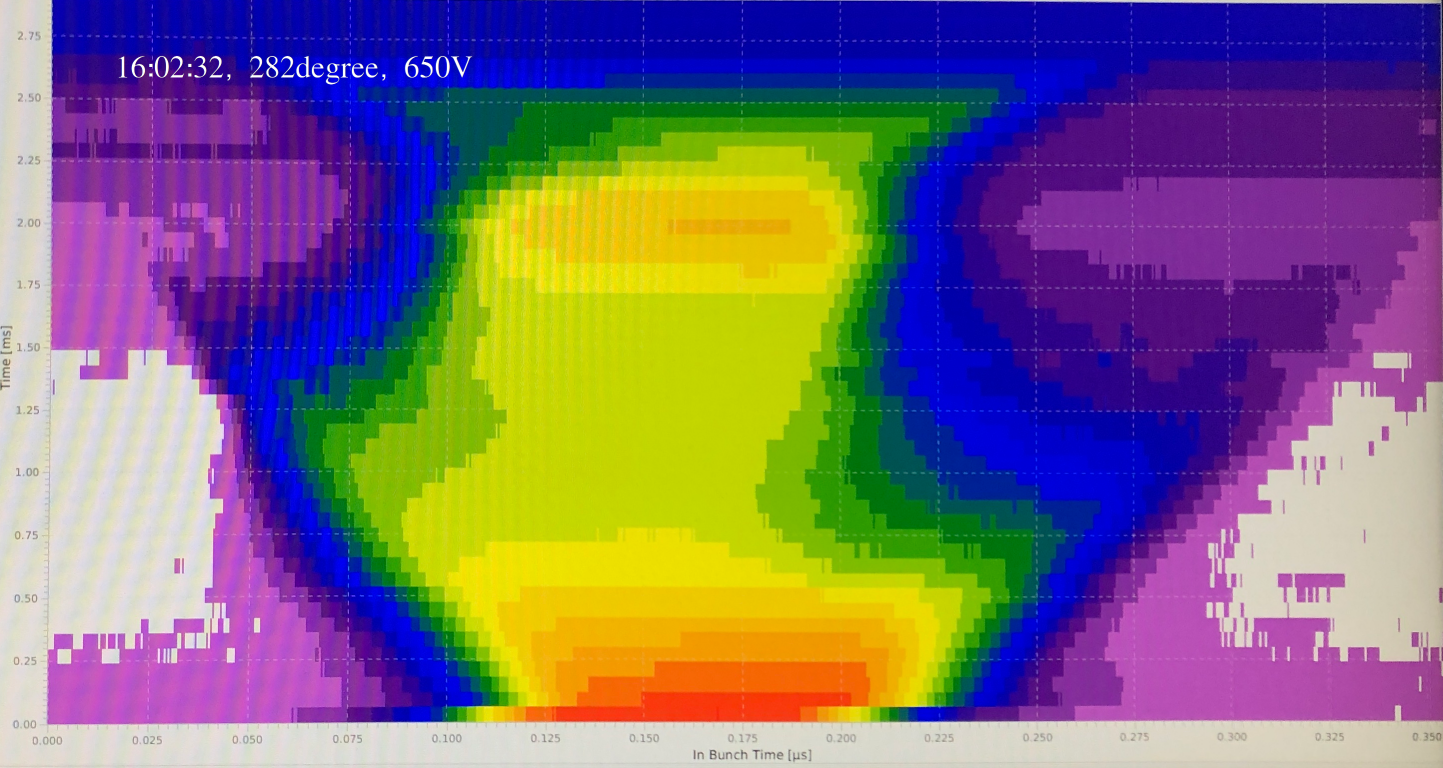
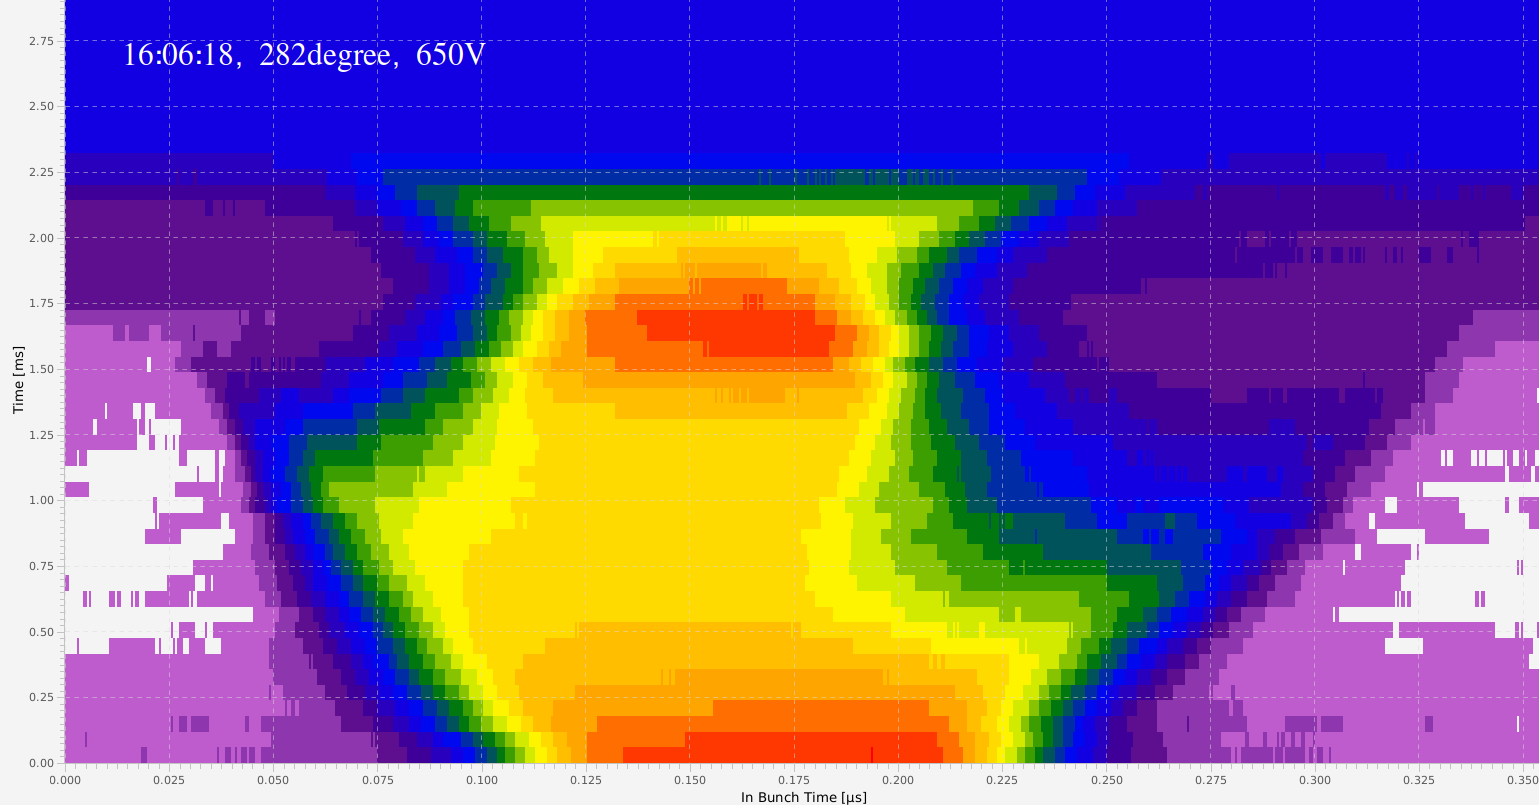
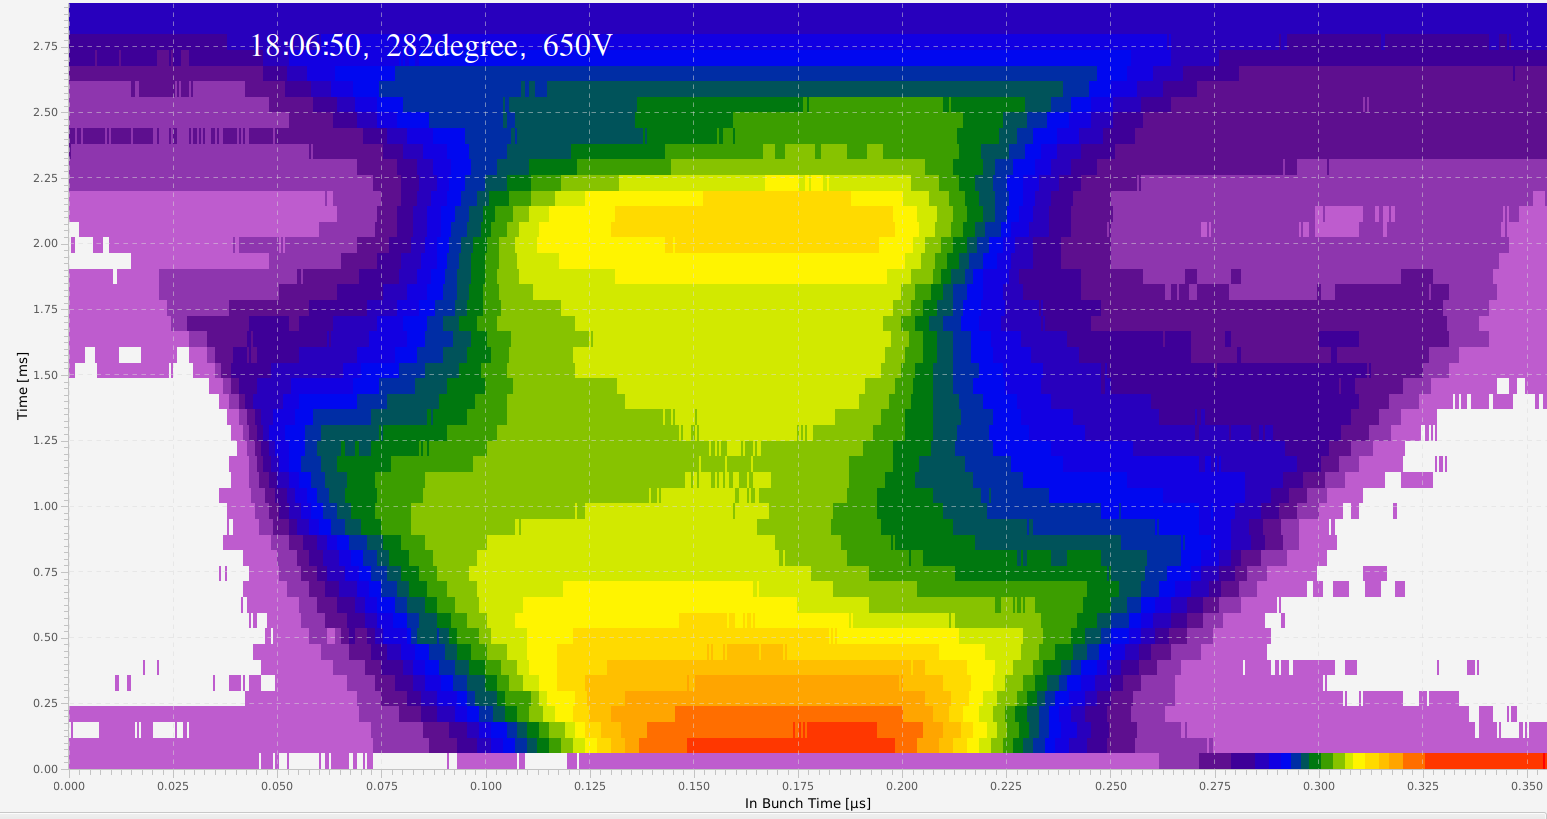
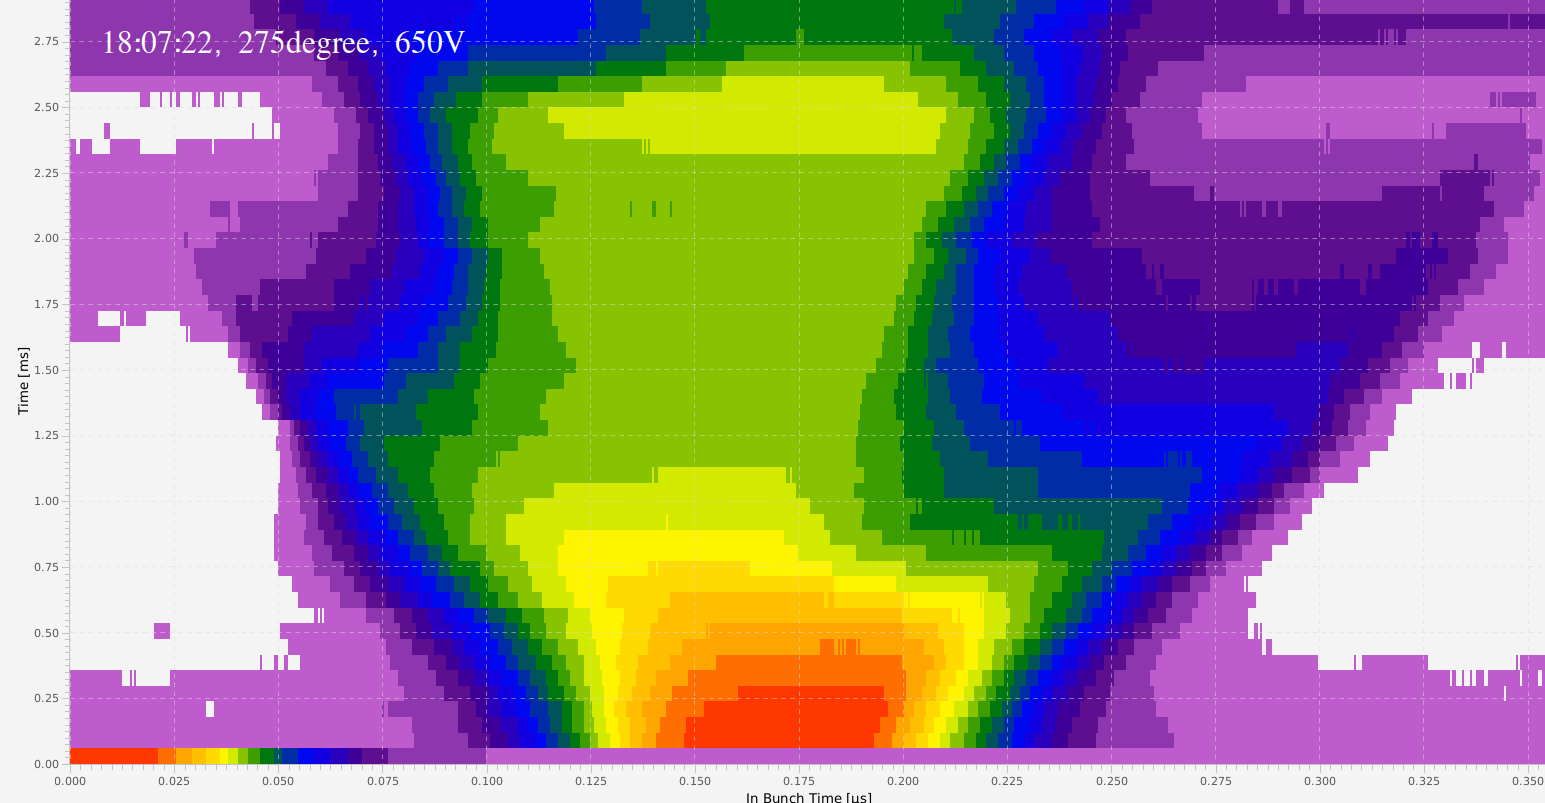
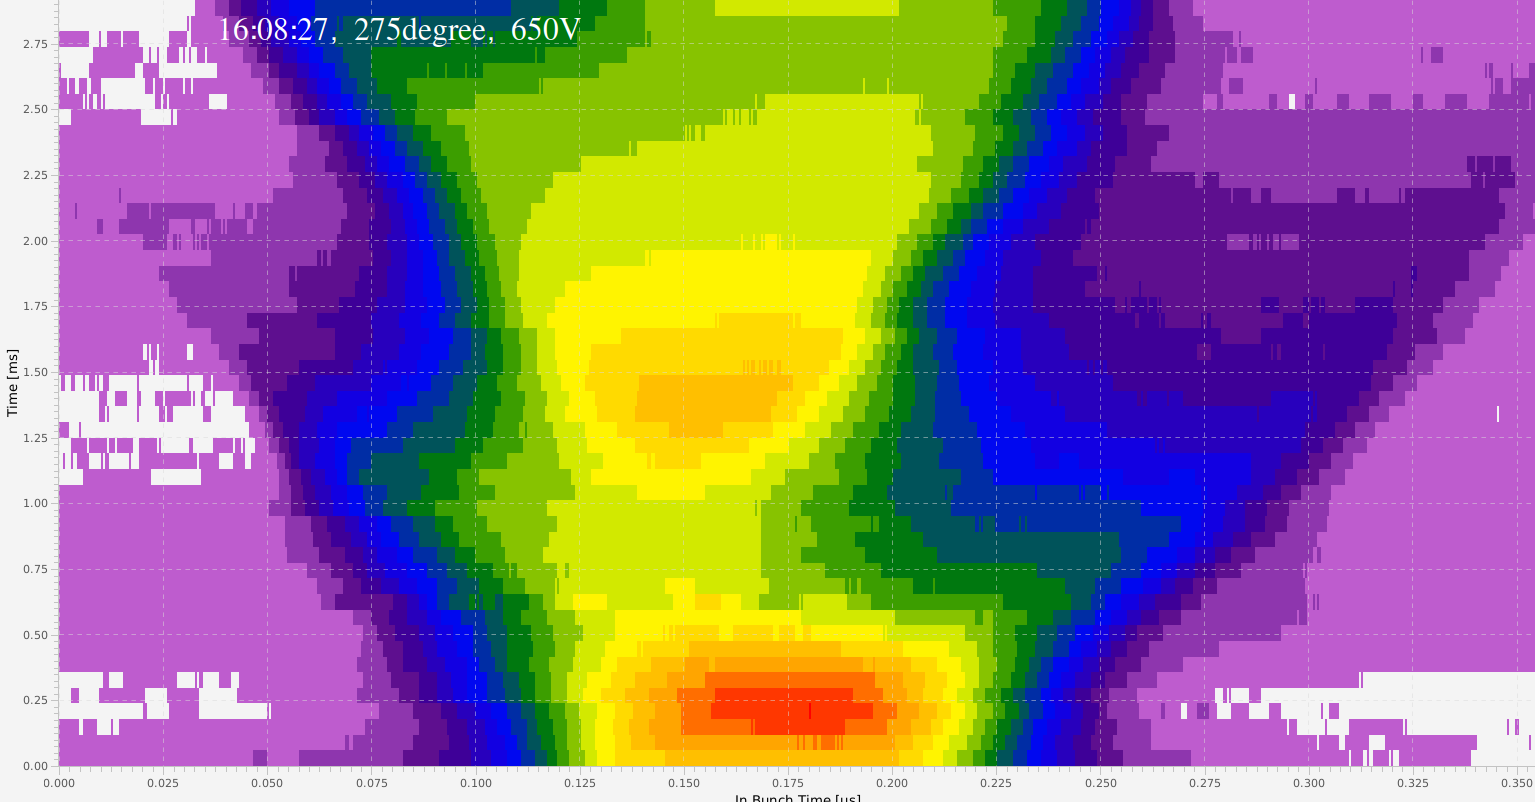
 Figure: 275 degree phase difference.
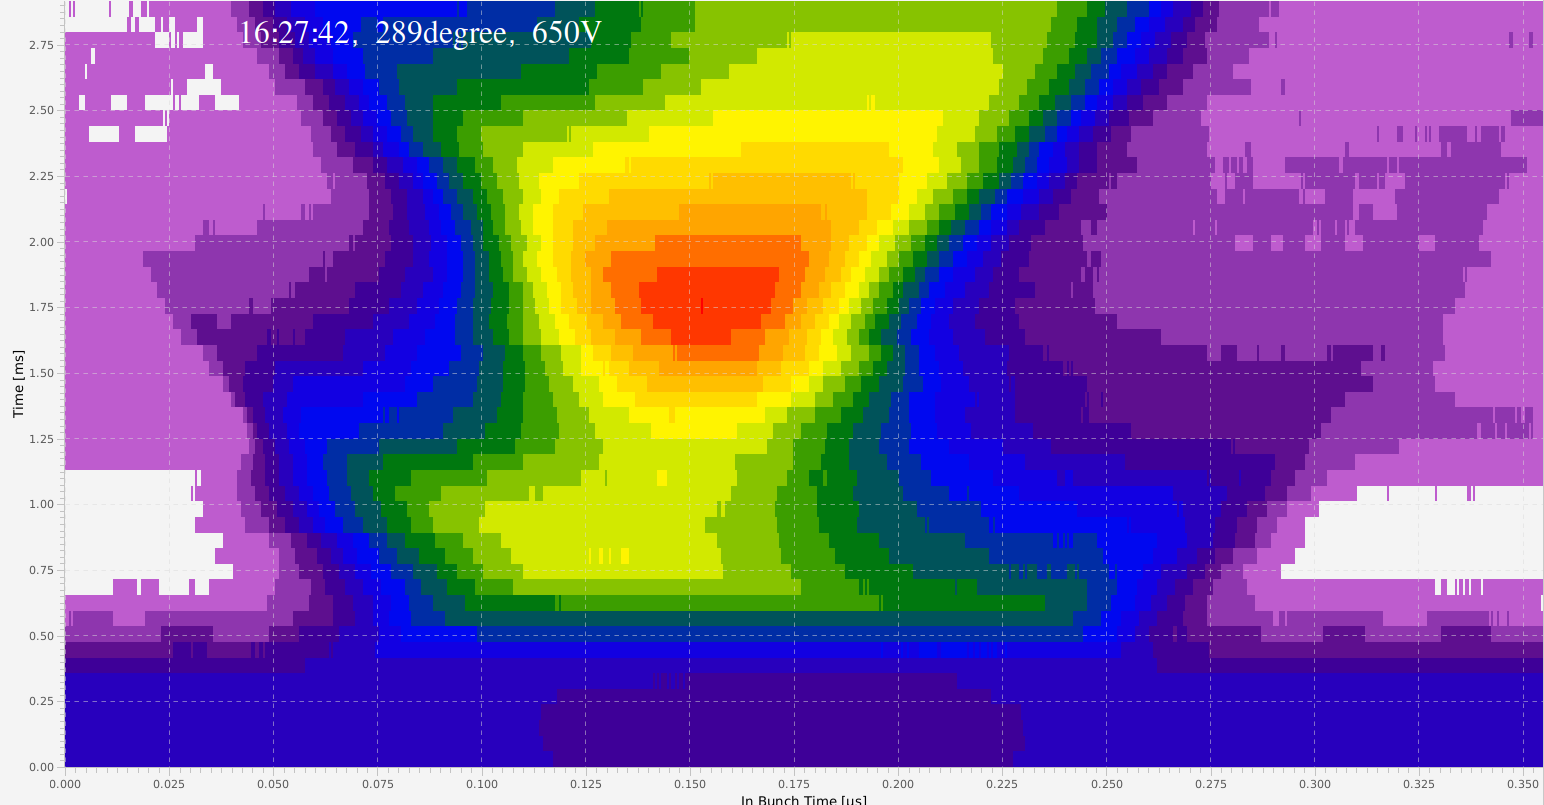
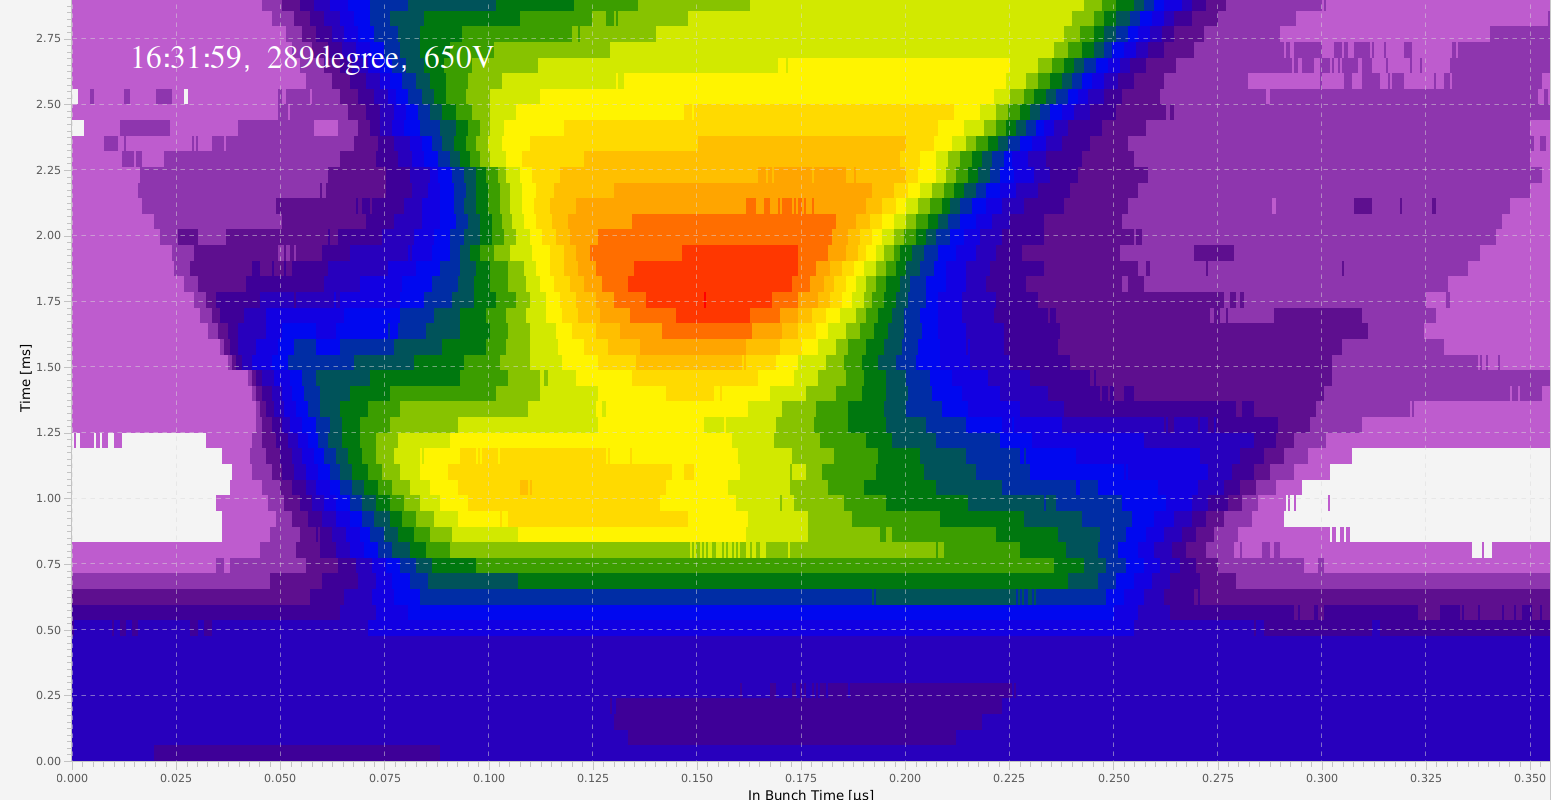 Figure: 289 degree phase difference, optimum phase difference (see below).
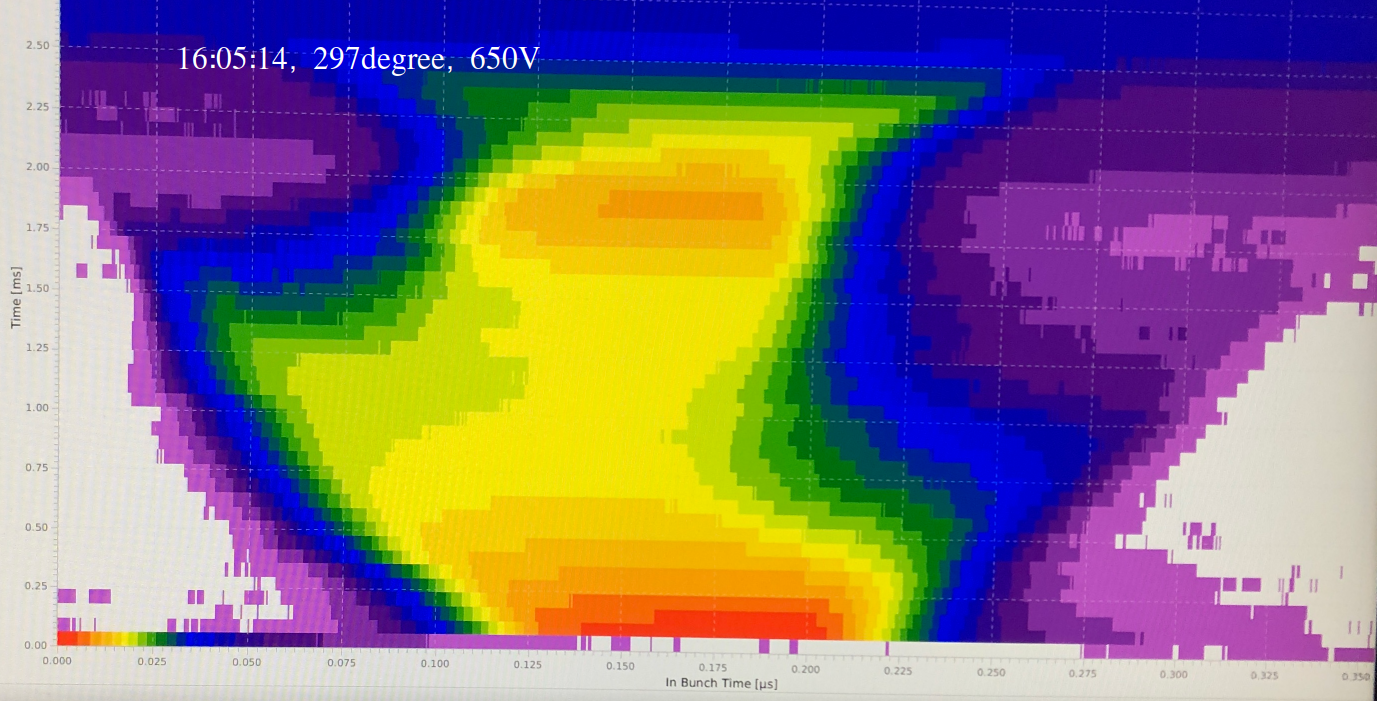
 Figure: 297 degree phase difference.
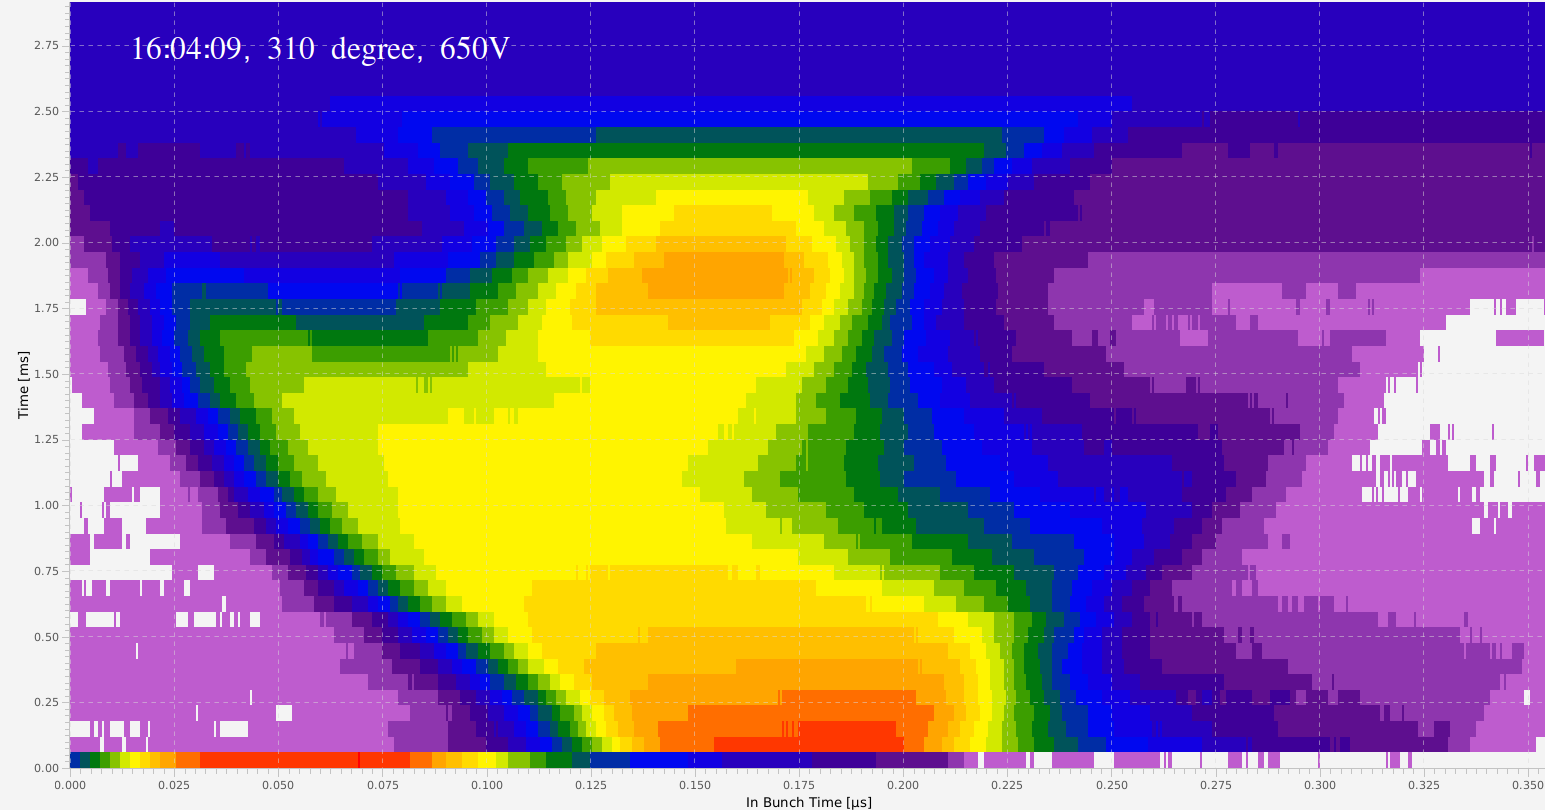
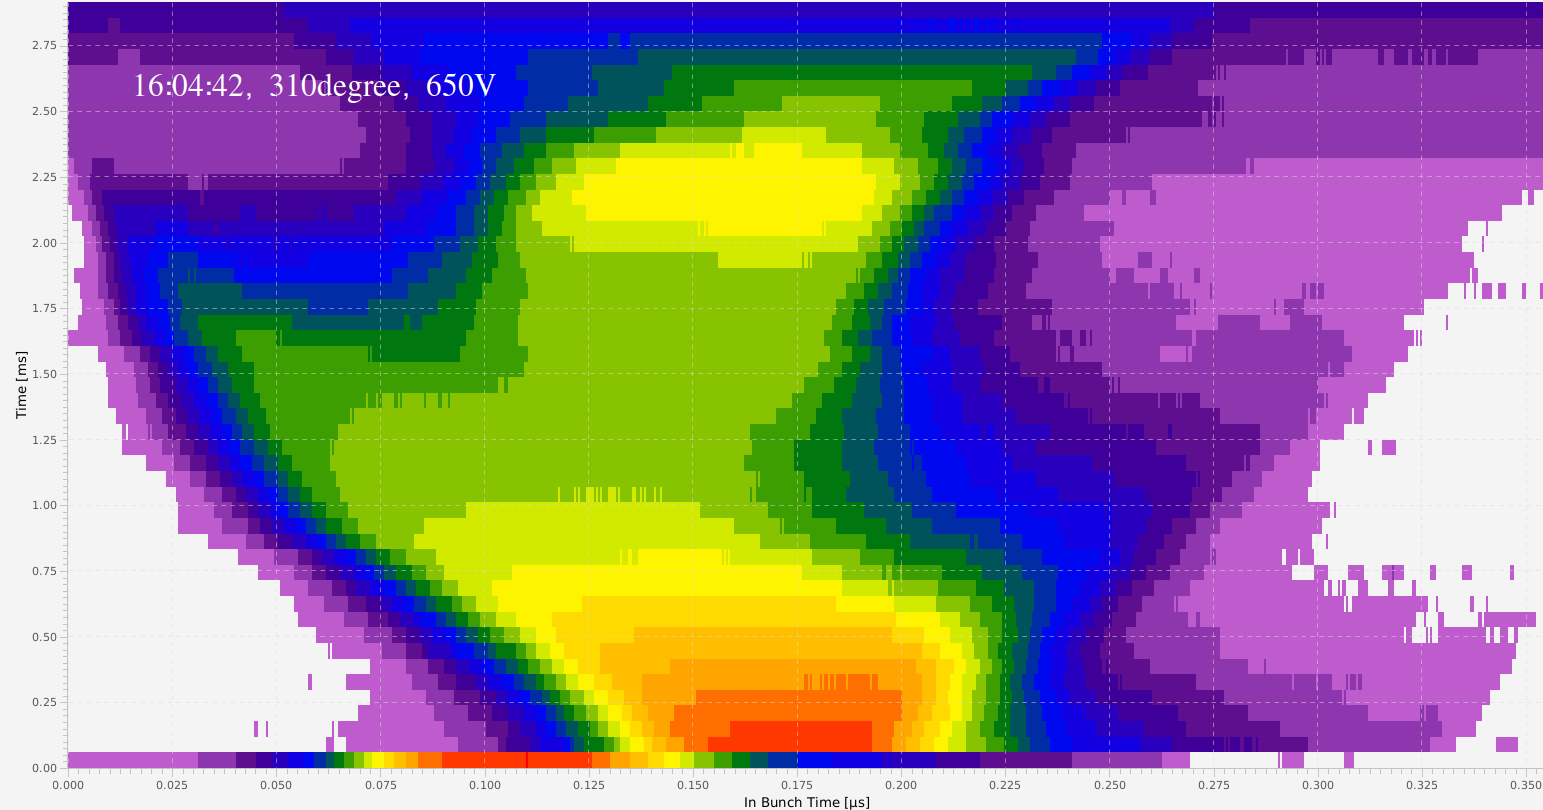 Figure: 310 degree phase difference.
 Figure: 361 degree phase difference.
Determining the Best Phase Difference
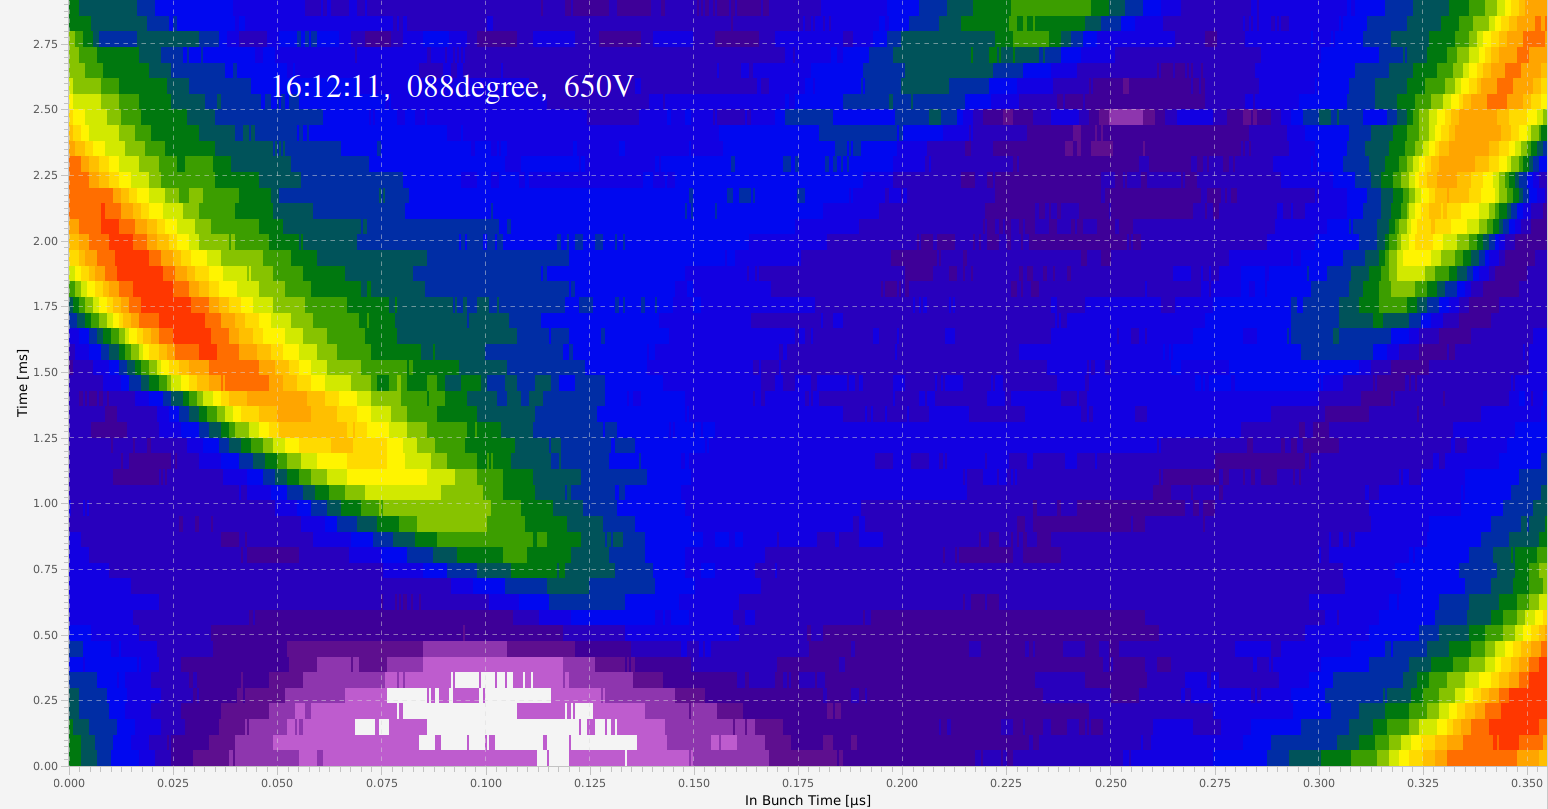
Basically, we are novices here. As we tried to determine the best phase, the rf-amplitude was probably to large and it looks like the observation was hampered by quadrupole osciallations. As an alternative we tried to define the best phase, by first finding the worst (= most destructive phase) and then simply add 180 degree. All of the following measurements have been done with identical gap voltage of 650V in the ESR (ferrit cavity). Figure: 88 degree phase difference.
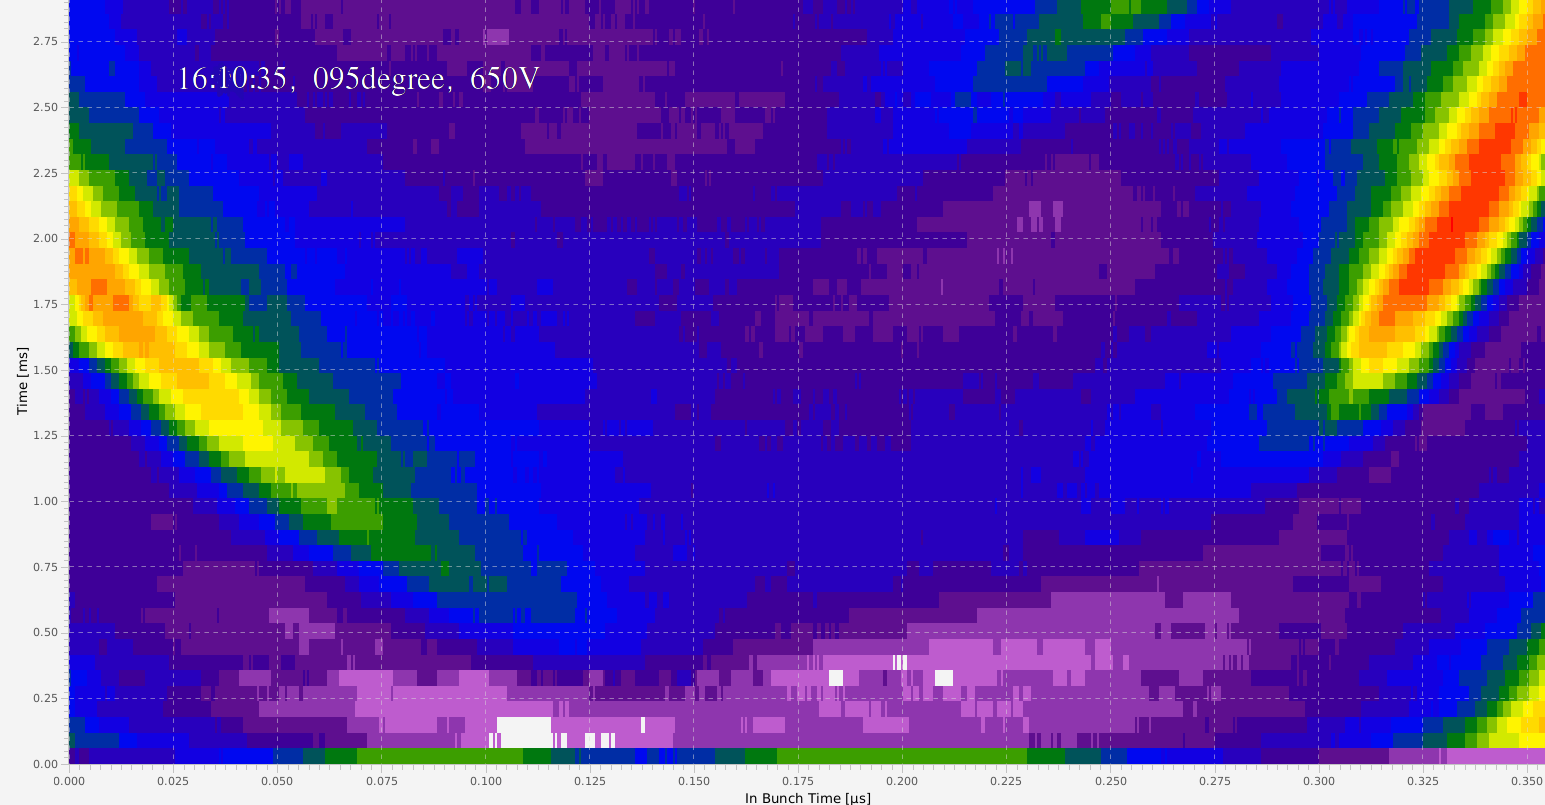
 Figure: 95 degree phase difference.
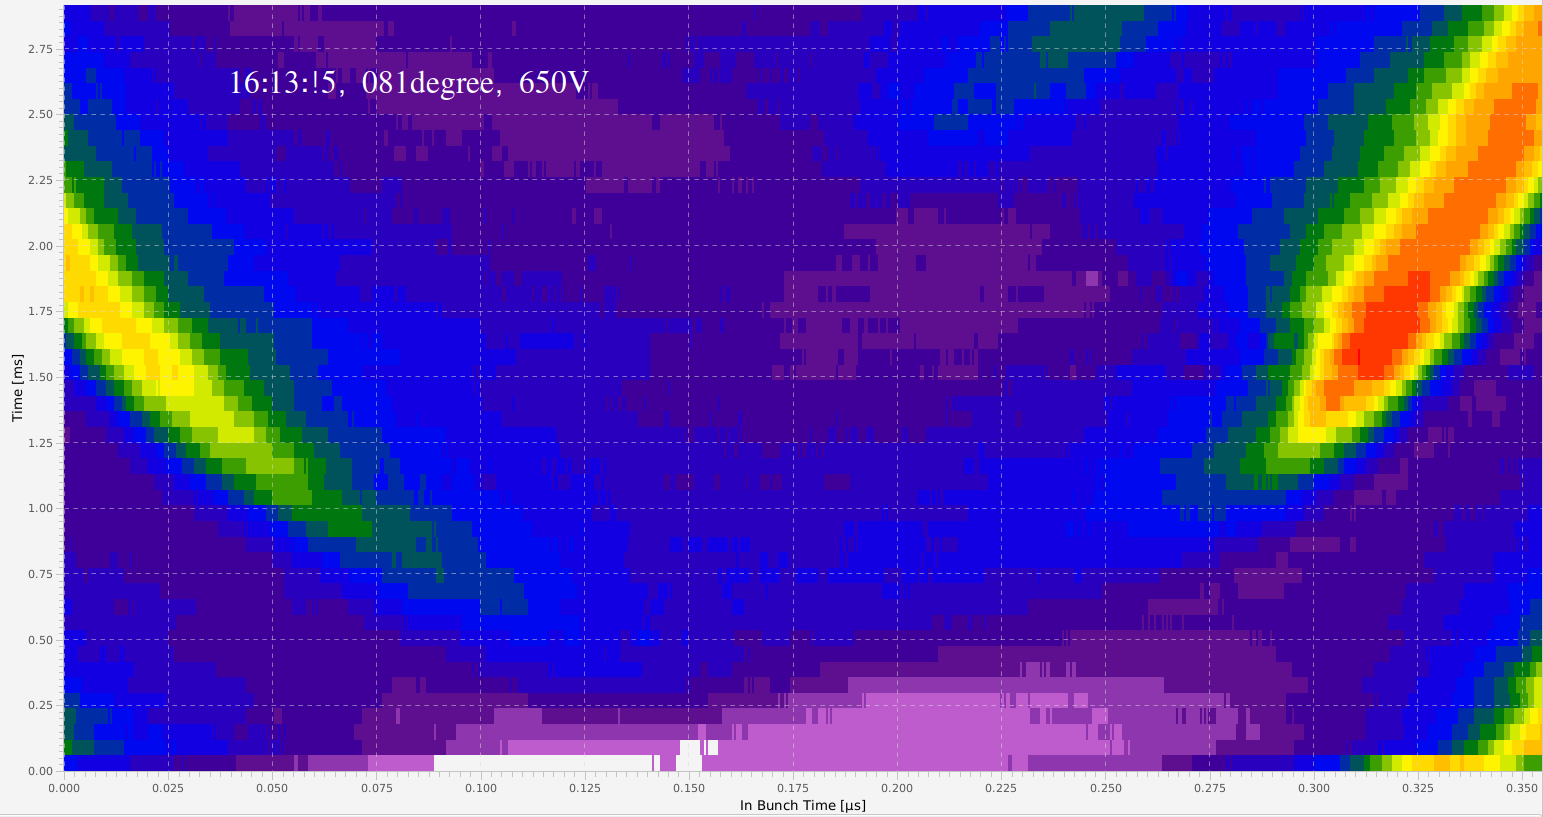
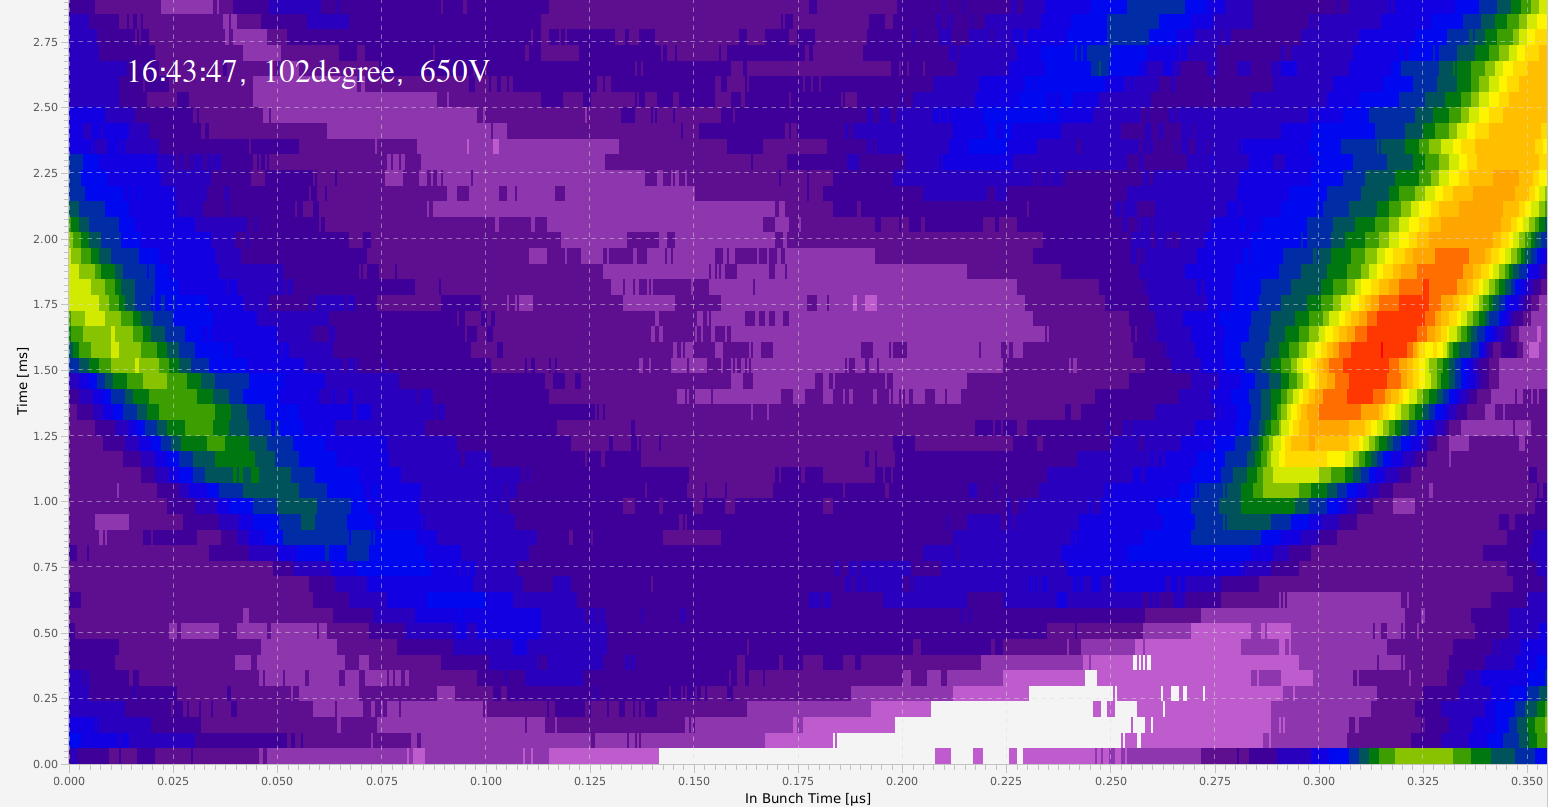
 Figure: 102 degree phase difference.
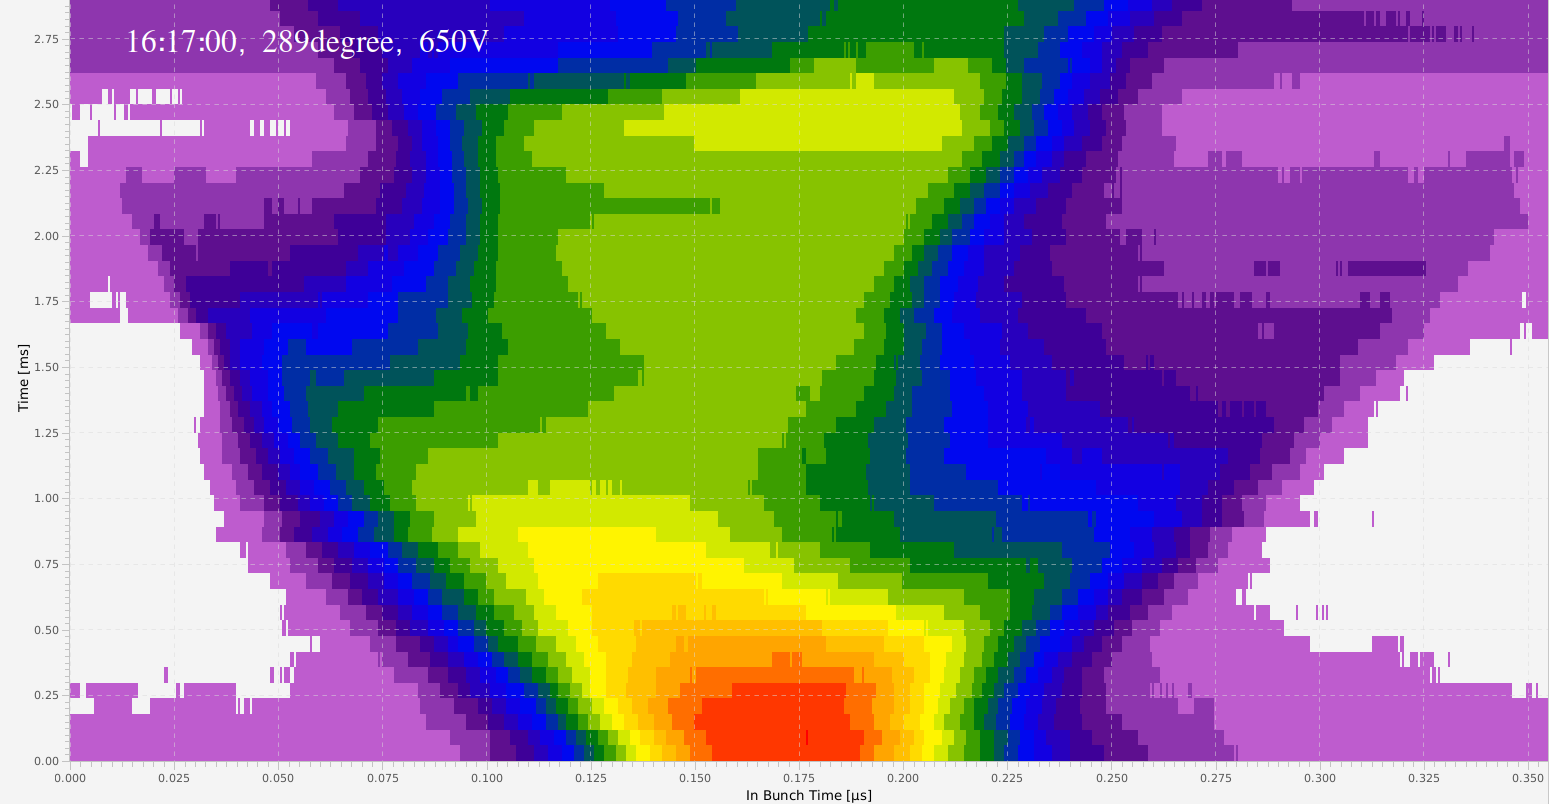
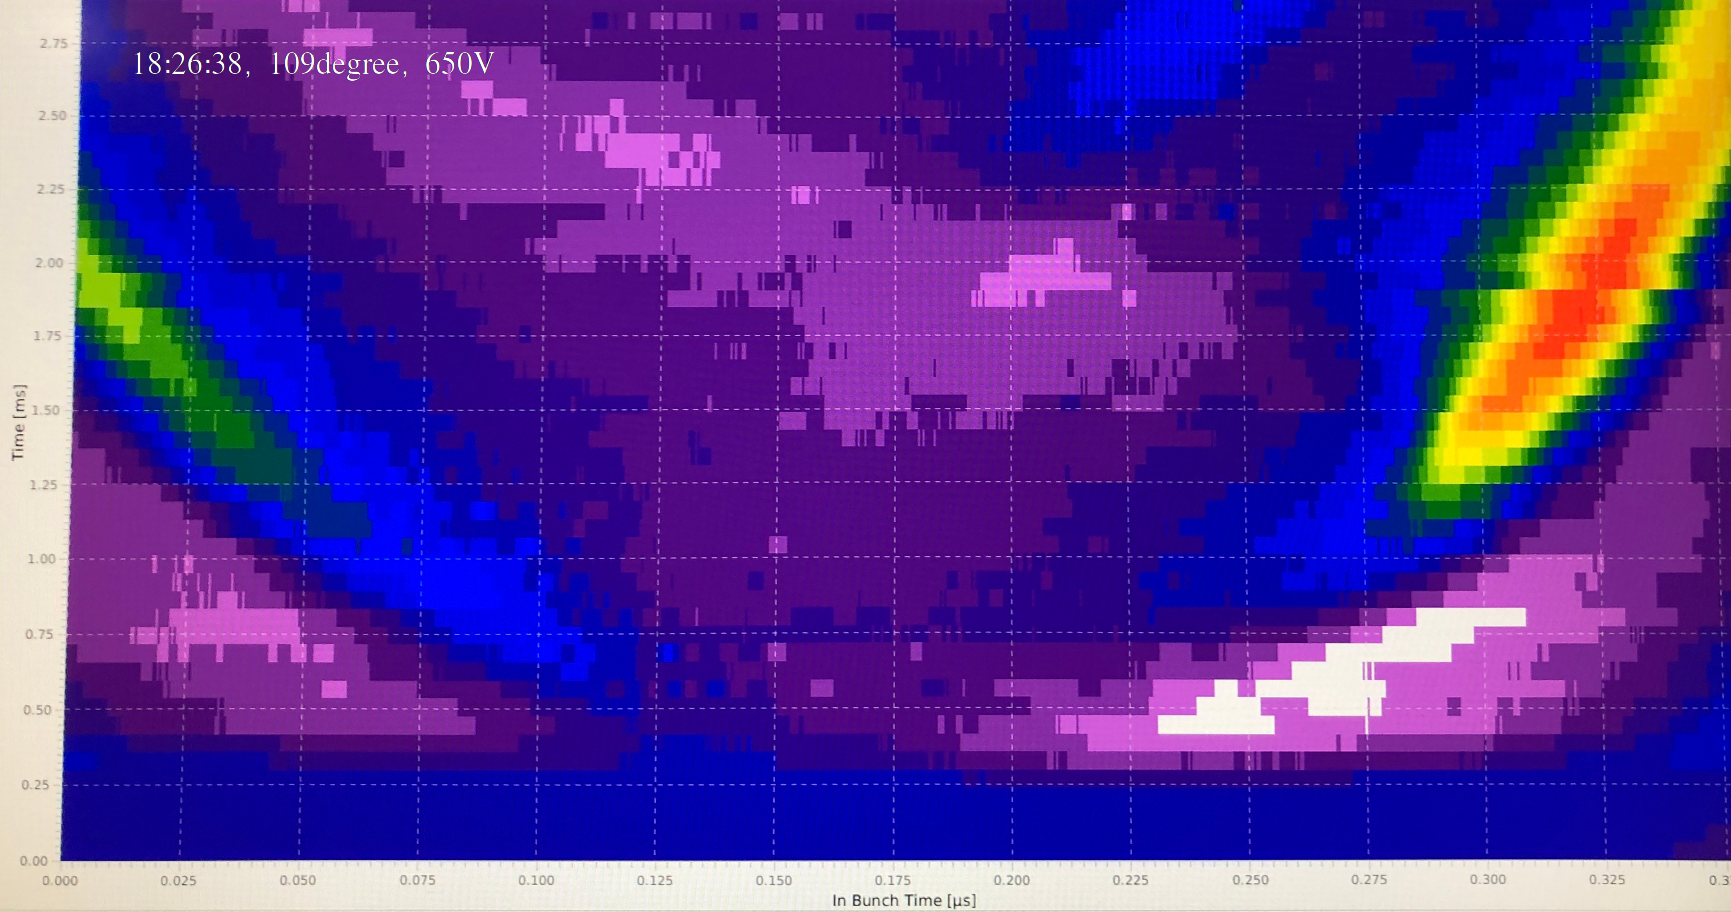
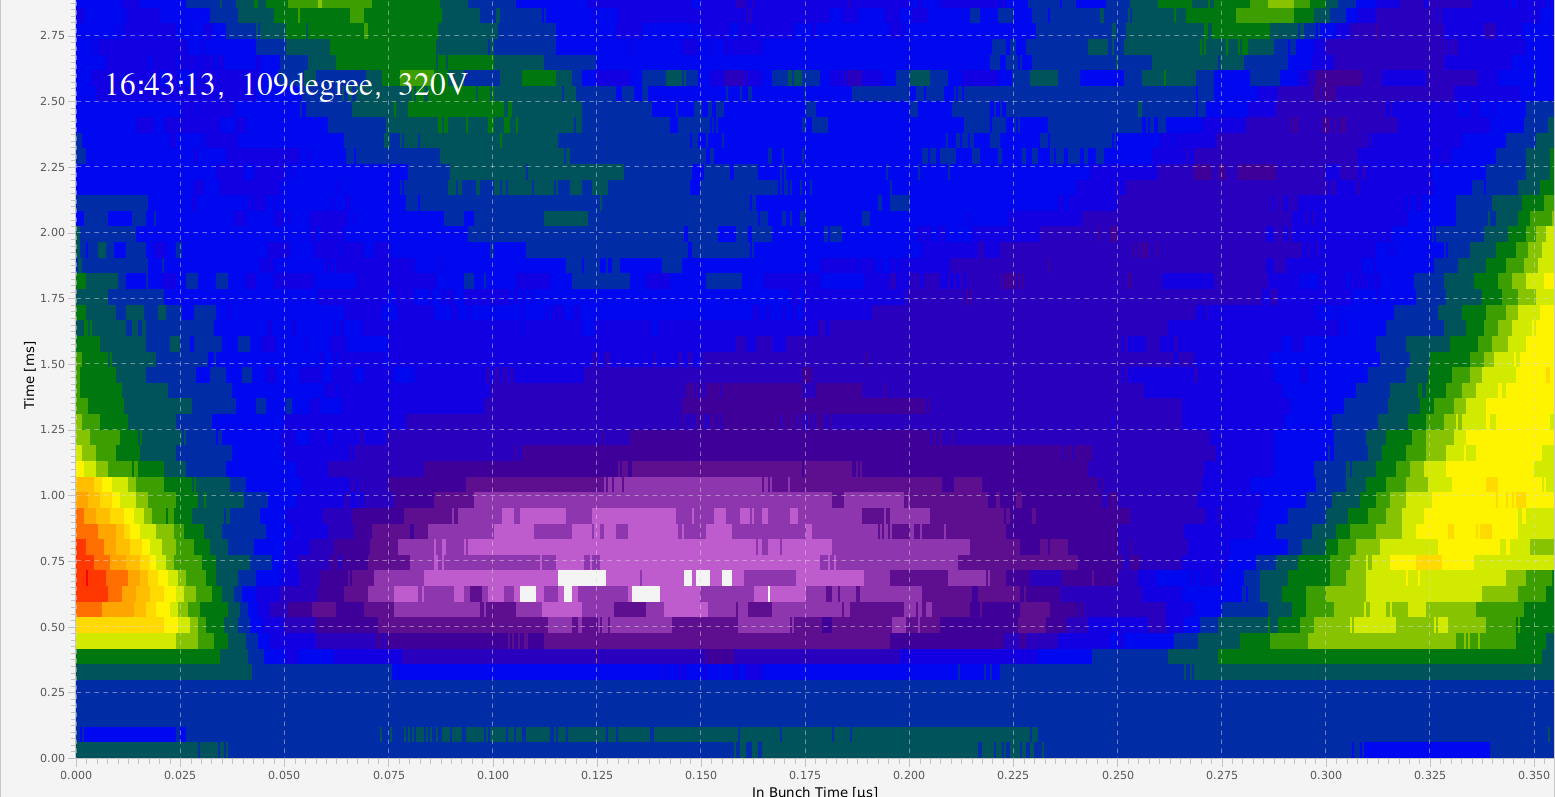
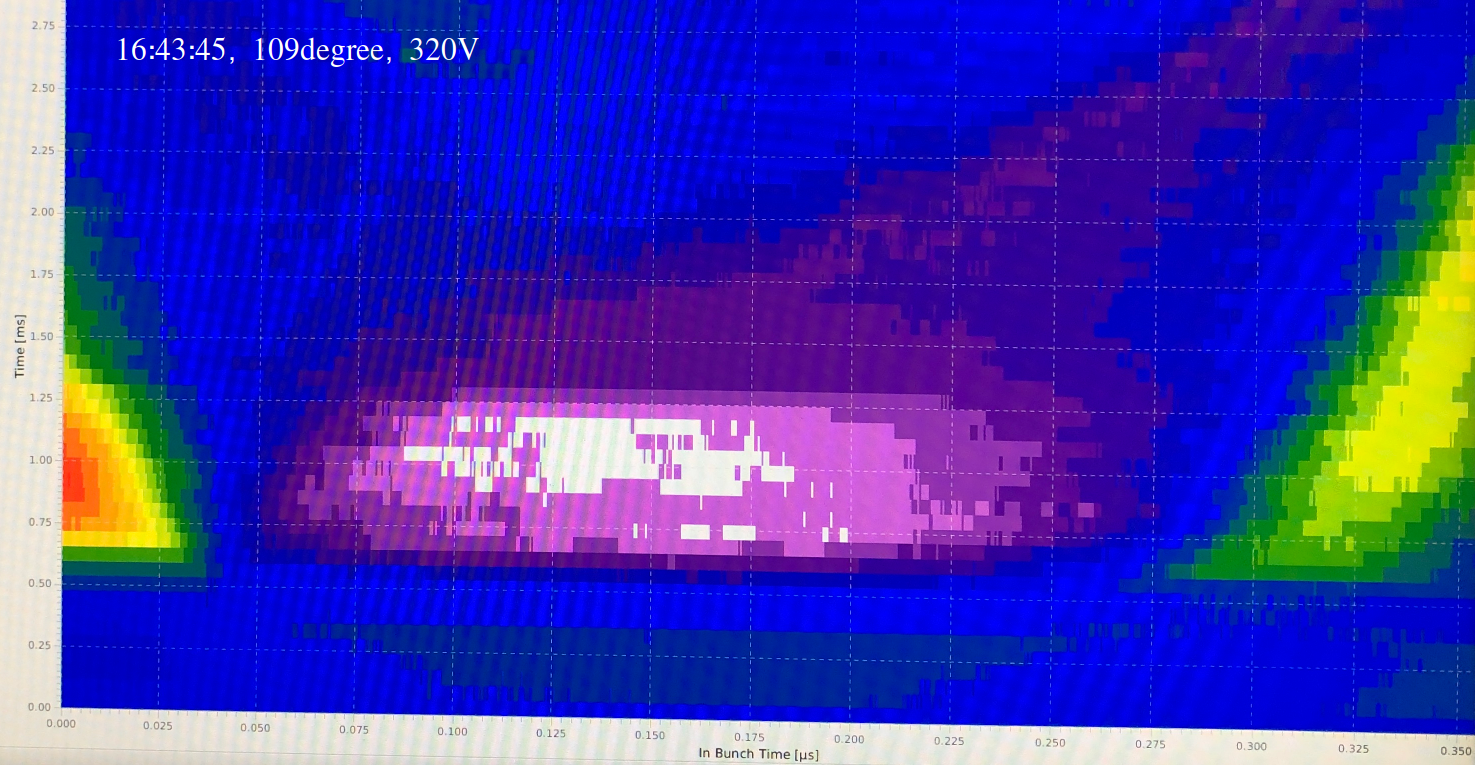
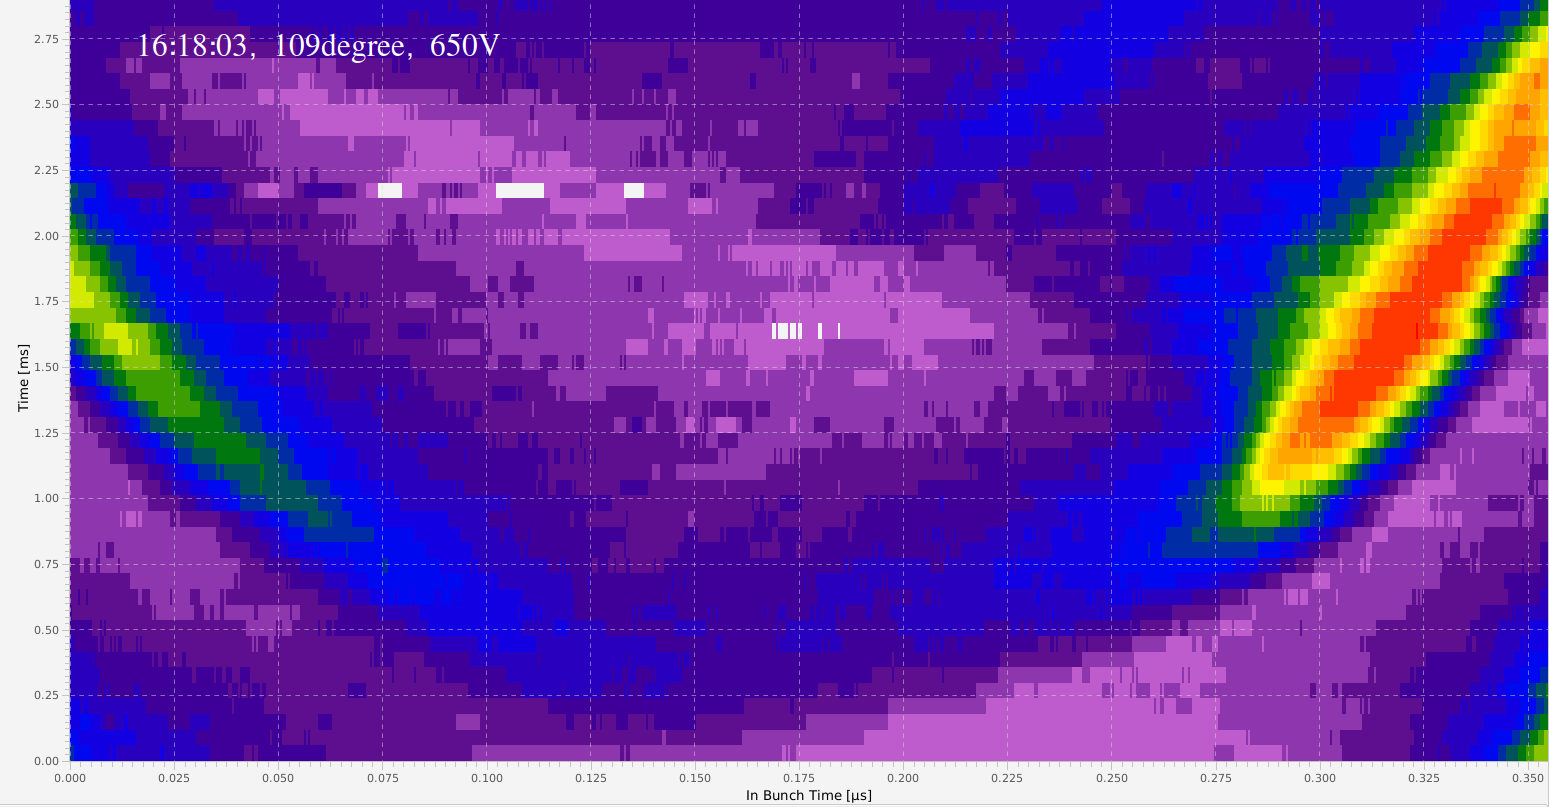 Figure: 109 degree phase difference. Looks symmetrically worst!
It was decided that 109 degree looks most symmetrical. Thus, the best phase difference is expected at 109 + 180 = 289 degree.
Figure: 109 degree phase difference. Looks symmetrically worst!
It was decided that 109 degree looks most symmetrical. Thus, the best phase difference is expected at 109 + 180 = 289 degree.
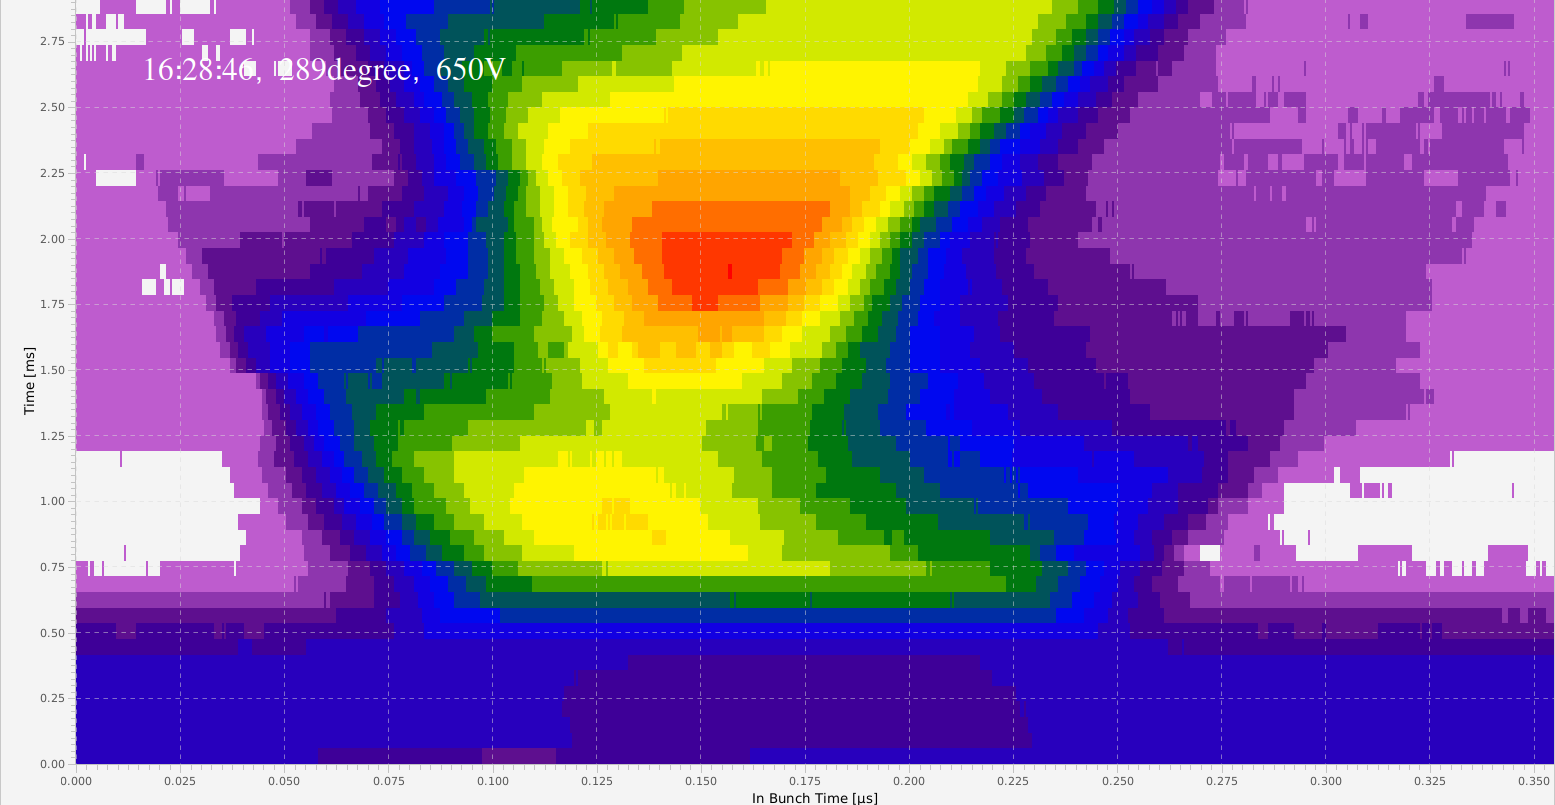
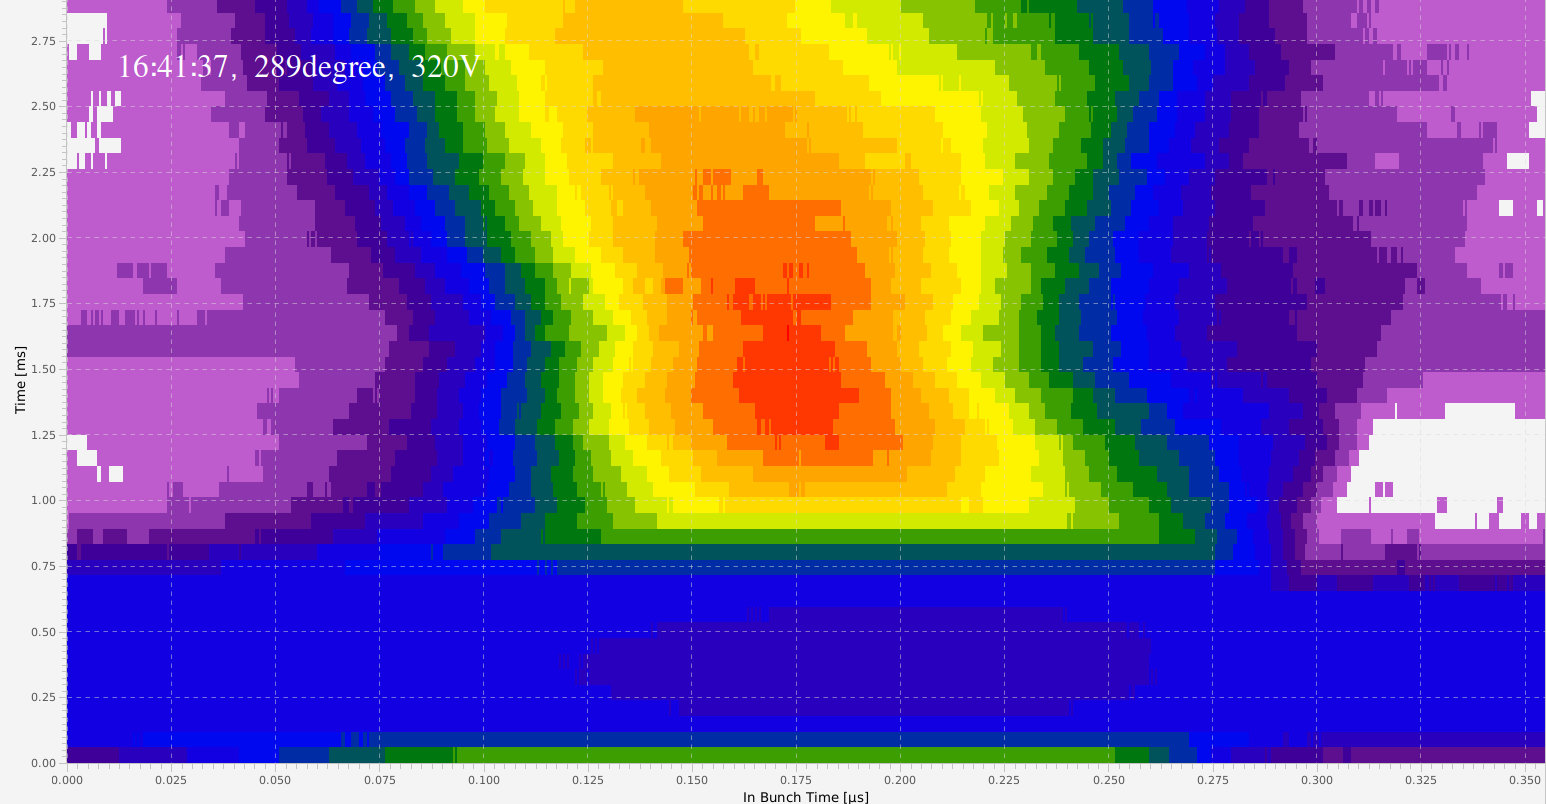
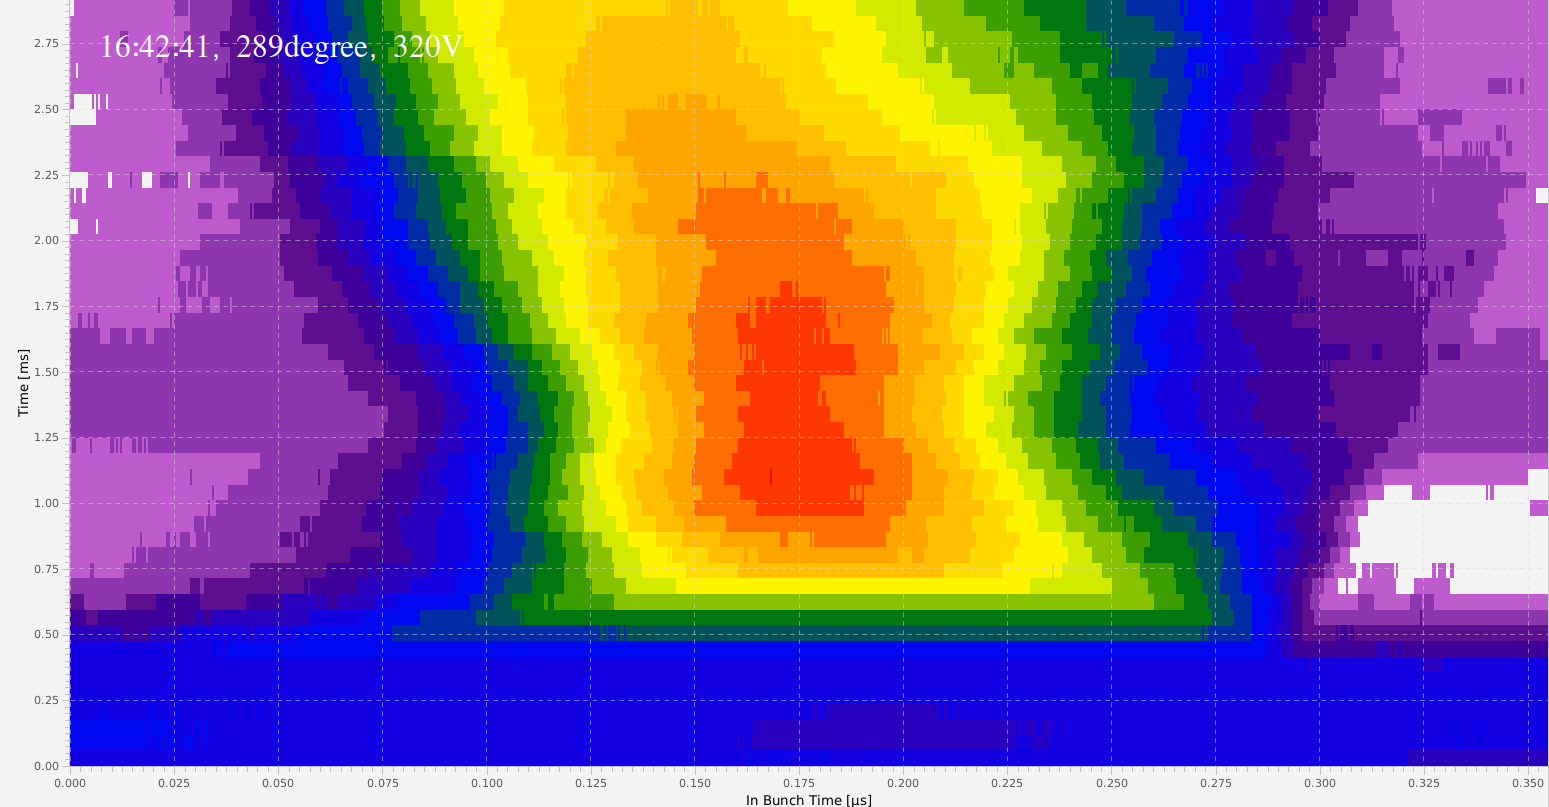
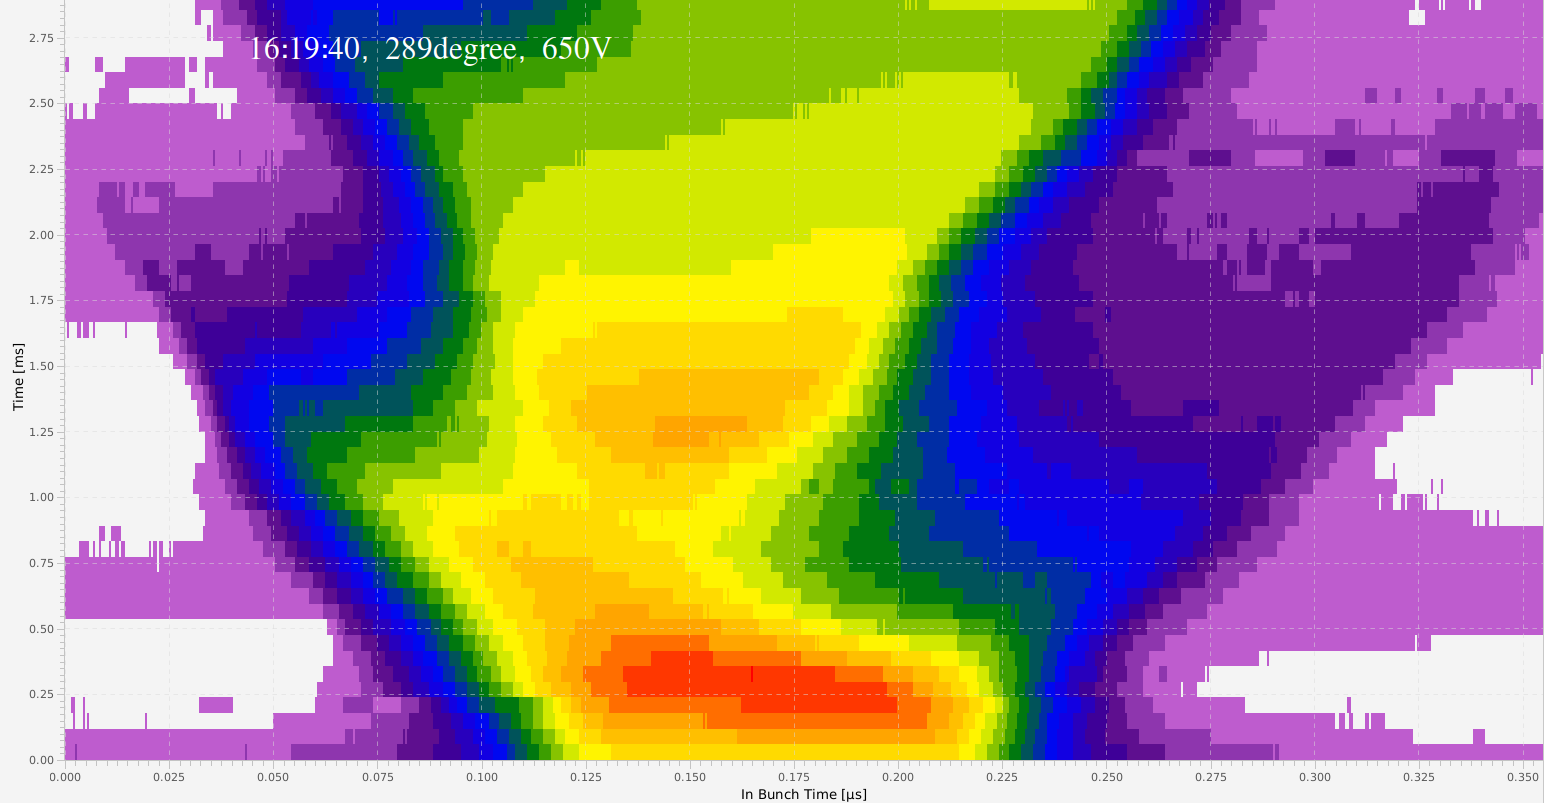 Figure: 289 degree phase difference. This is supposed to be the best phase difference for the actual conditions.
Idea: Finding the best conditions involves multiple measurements like the one above but for different rf-gap-voltages.
Figure: 289 degree phase difference. This is supposed to be the best phase difference for the actual conditions.
Idea: Finding the best conditions involves multiple measurements like the one above but for different rf-gap-voltages.
RF Gap Voltage
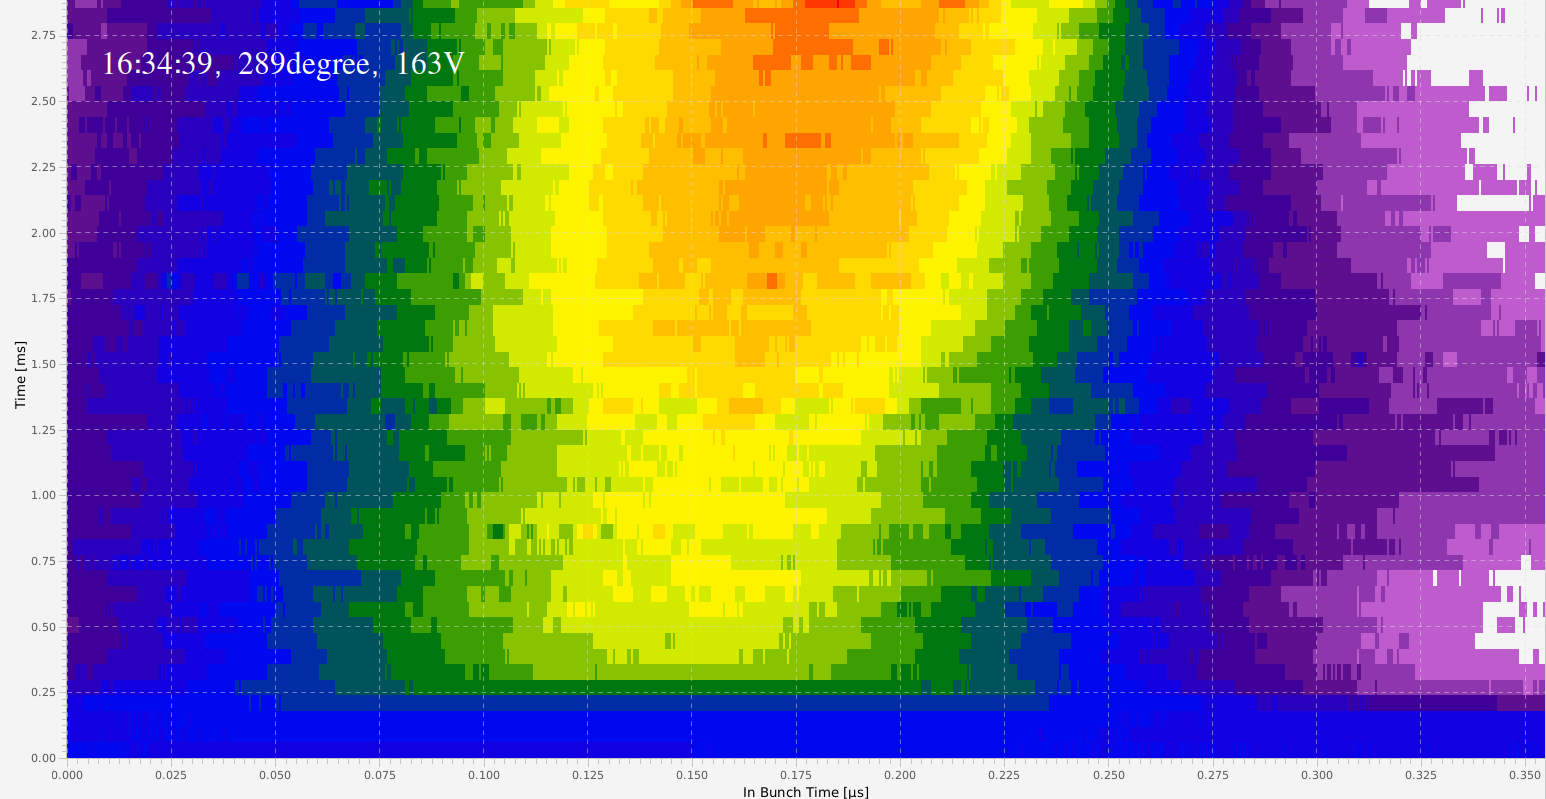
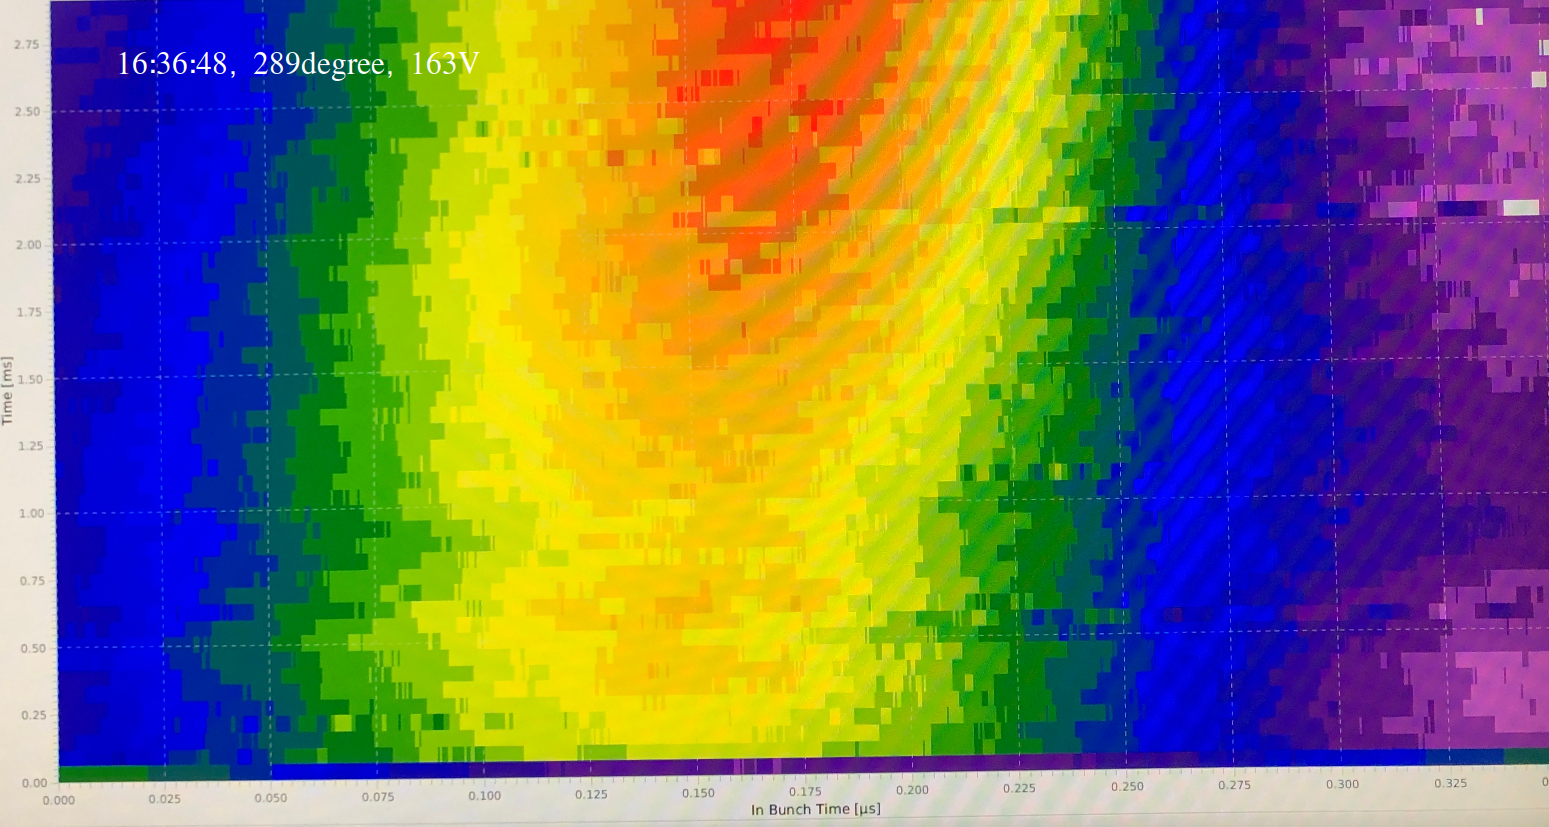
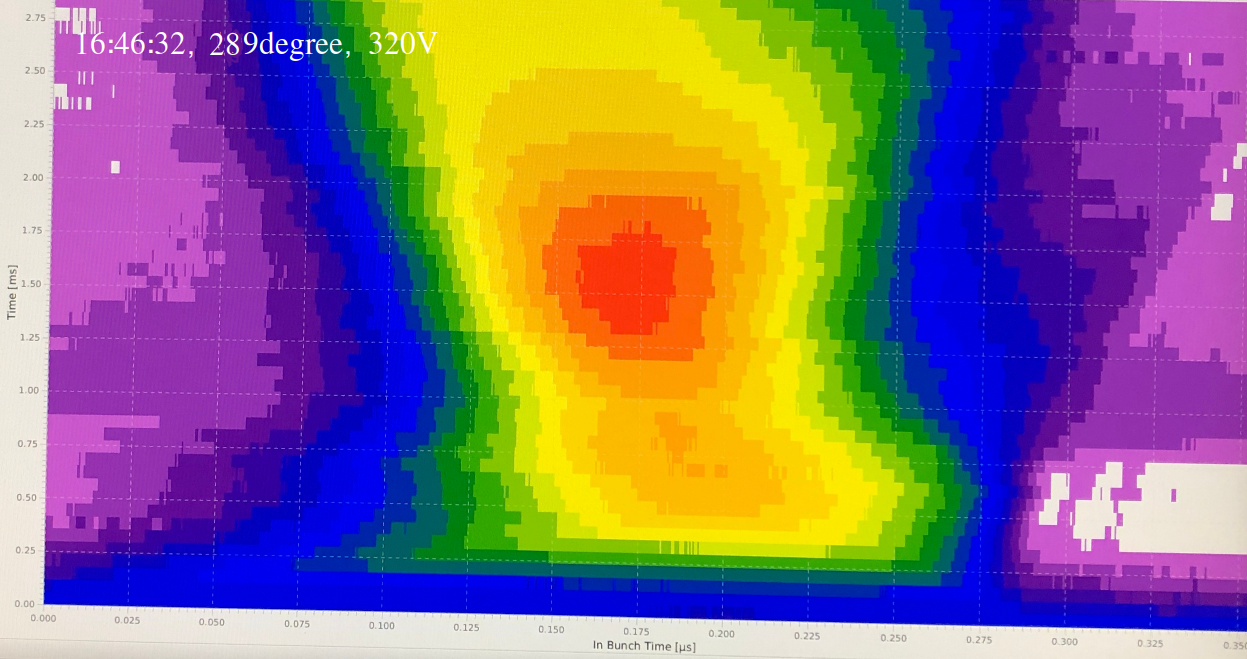
It looks like an important parameter is a good value of the RF Gap Voltage. I (db) am not an accelerator physicist, but my naive view is that the 'trapping potential' of the rf-buckets in the injection ring shall match the one of the extraction ring when the bunches are transferred. All of the following measurements have been done with identical rf-phase difference of 289 degree.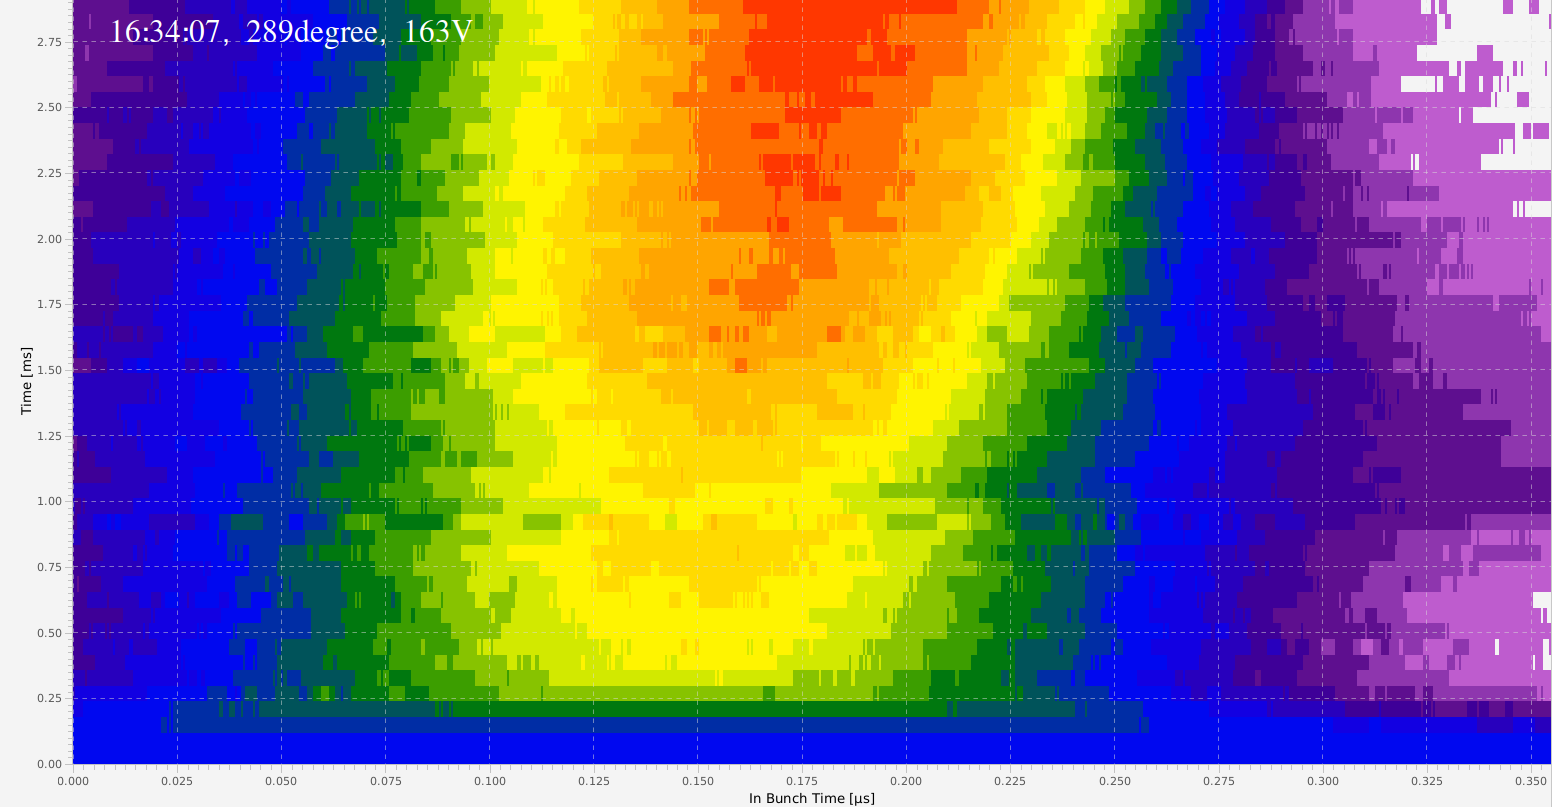 Figure: 163V gap voltage.
 Figure: 320V gap voltage.
Figure: 650V gap voltage.
Figure: 320V gap voltage.
Figure: 650V gap voltage.
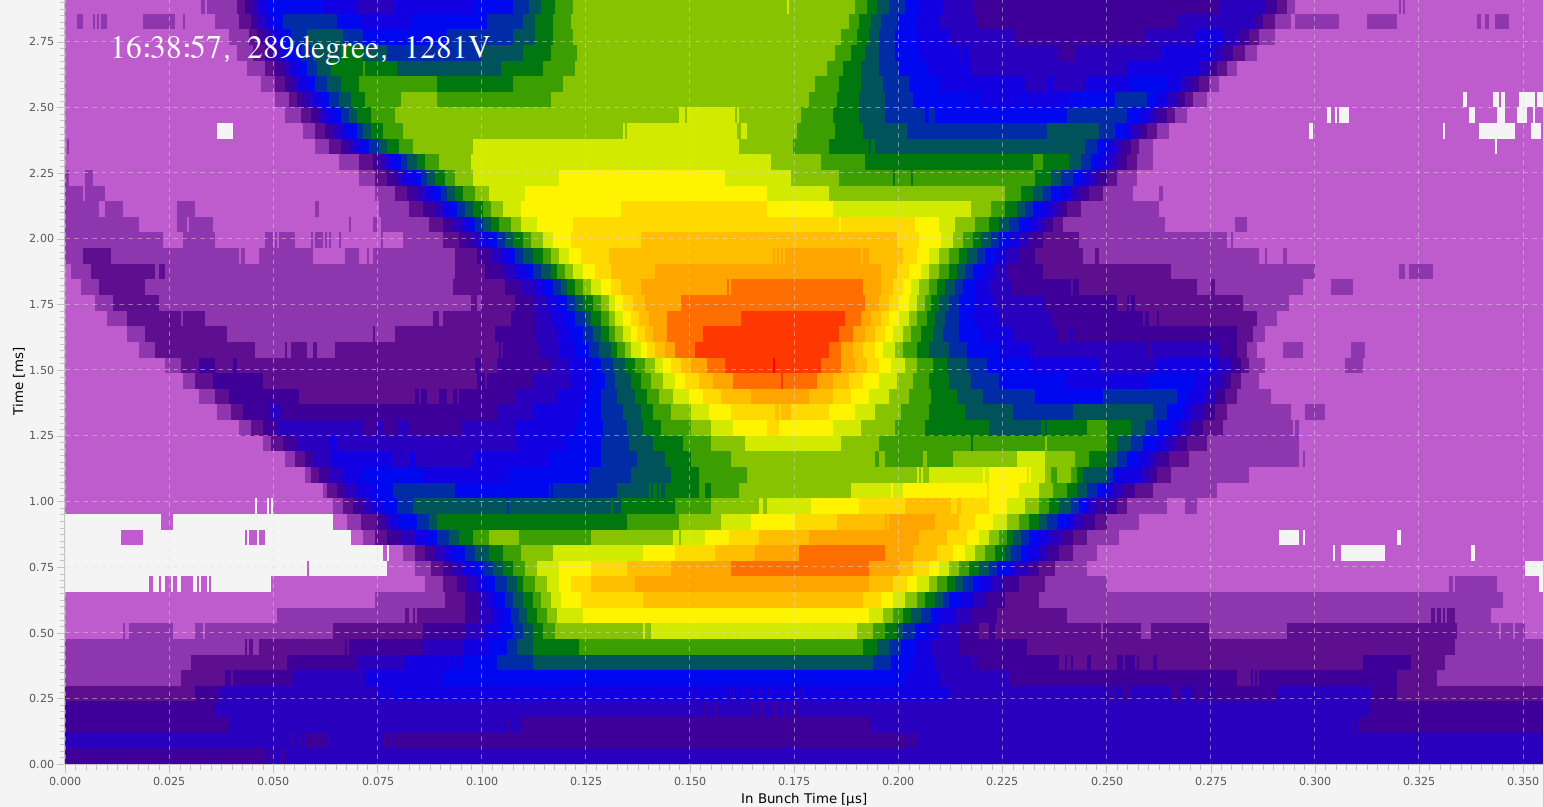 Figure: 1281V gap voltage.
Reproducibility
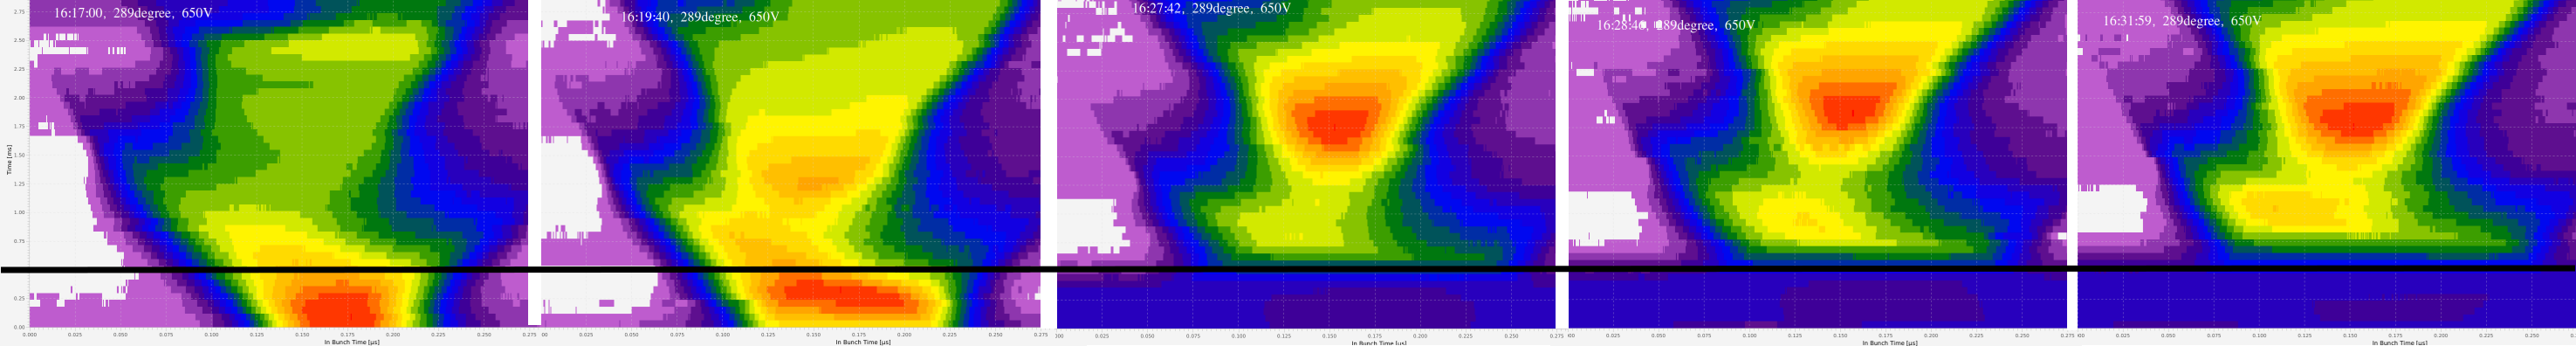 Figure: Bunch-to-Bucket transfers at identical conditions. The black horizontal line serves to guide the eye.
The figure above compare transfers that have been done with identical conditions (relative phase 289 degree, gap 650V). Here, data acquisition has been started upon EVT_KICK_START1 + 1ms. However, the time of transfer may vary within a window defined by the beating method. At the three rightmost images, the beam is injected into ESR approximately 0.5ms after start of acquisition, while at the two left images the beam is transferred sooner. A horizontal black line is drawn ~0.5ms after data acquisition. It is interesting to note, that the outer boarders of the 'bunch shapes' almost look identical in all five images, only the 'position of highest intensity' seems to move.
Figure: Bunch-to-Bucket transfers at identical conditions. The black horizontal line serves to guide the eye.
The figure above compare transfers that have been done with identical conditions (relative phase 289 degree, gap 650V). Here, data acquisition has been started upon EVT_KICK_START1 + 1ms. However, the time of transfer may vary within a window defined by the beating method. At the three rightmost images, the beam is injected into ESR approximately 0.5ms after start of acquisition, while at the two left images the beam is transferred sooner. A horizontal black line is drawn ~0.5ms after data acquisition. It is interesting to note, that the outer boarders of the 'bunch shapes' almost look identical in all five images, only the 'position of highest intensity' seems to move.
Stability and Precision
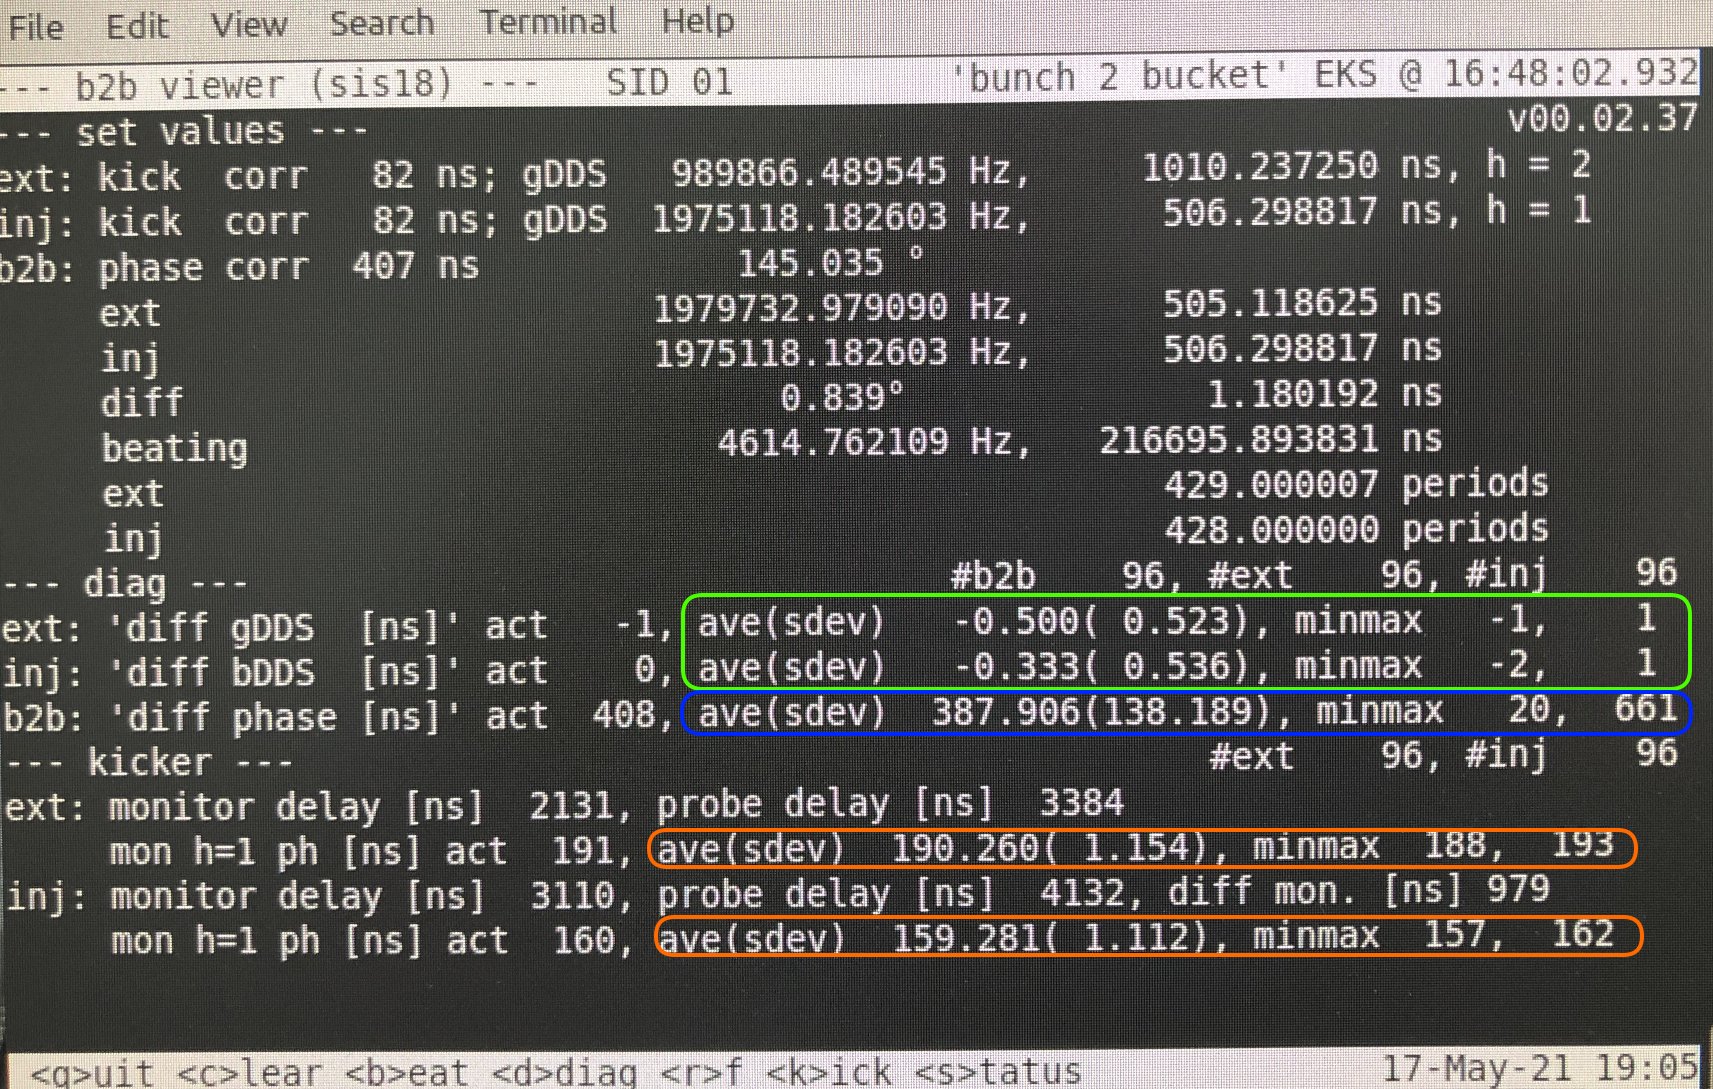 Figure: On-line data by the b2b system. Stability is demonstrated by the good match of DDS signals (green boxes) and kicker timing (orange boxes). The phase difference of the DDS signals (blue box) is averaged over one hour. Details (see text). Statistical data (average, standard deviation, min, max) represents data of 96 bunch-to-bucket transfers.
The figure above shows the key parameters of the experiment for 96 buncht-to-bucket transfers.
Figure: On-line data by the b2b system. Stability is demonstrated by the good match of DDS signals (green boxes) and kicker timing (orange boxes). The phase difference of the DDS signals (blue box) is averaged over one hour. Details (see text). Statistical data (average, standard deviation, min, max) represents data of 96 bunch-to-bucket transfers.
The figure above shows the key parameters of the experiment for 96 buncht-to-bucket transfers. - beating period ~216 us (~429 rf periods)
- extraction: h=2; injection h=1
- ext(traction): shows the deviation between measured and set-value; the set-value for kicker correction is already subtracted. In the ideal case, this should be 0 ns.
- inj(ection) : shows the deviation between measrued and set-value; the set-value fors kicker correction as well as the phase difference are already subtracted. A perfect phase match yields a value of 0 ns!
Trapping Efficiency with B2B
Unfortunately, we were unable to record long (seconds) signals. Fortunately, one of the analog instruments displayed the signal strength as a function of time for the optimum and worst phase. A screenshot is given in the figure below. First, it can be observed that the bunch remains stored for many seconds in both cases. For the 'worst case', the measured signal (in Volts) is 12 db less than with the 'optimum case'. Thus the signal strength (in Volts) is a factor of four less. This should correspond to the number of stored particles. Thus, when comparing 'worst'/'optimum' phase, the number of particles stored in rf-buckets differs by a factor of four. Remark: There could be more particles in the ring, but these would be outside the RF-potential and lost upon further manipulation such as acceleration or decelaration.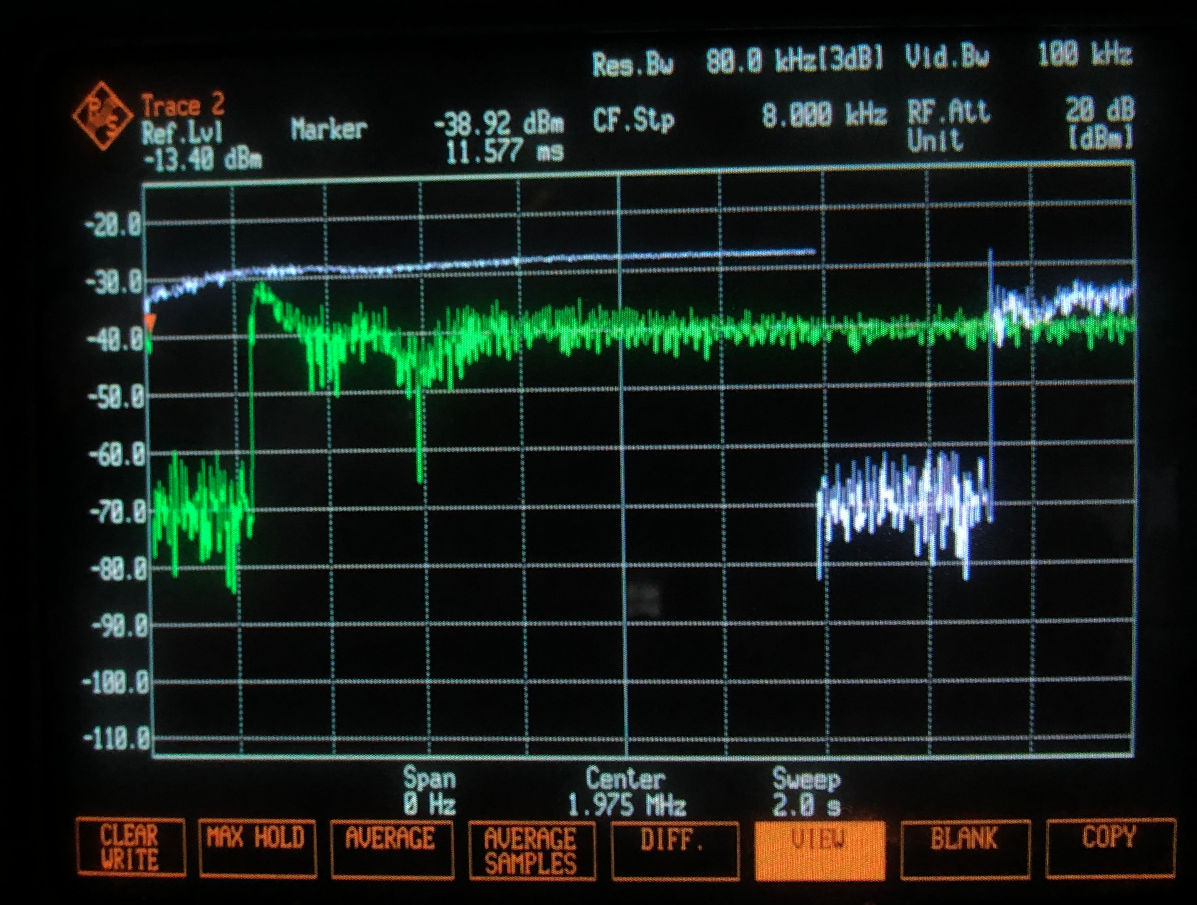 Figure: Signal strength of stored beam as a function of time. Shown are two traces. Optimum phase difference of 289 degree (white) and 'most destructive' phase difference of 109 degree (white). When comparing the signal strength for long storage time of about 1s (middle) the signal of the 'worst' phase difference is attenuated by ~ 12db compared to the case, when the bunch-to-bucket transfer is done with correct phase.
Conclusion
The bunch-to-bucket transfer system has been used in standard operation for about one week without issues. To continue using beam instrumentation devices connected to MIL timing, the bunch-to-bucket system should be triggered to an event different than EVT_KICK_START1/2. Real bunch-to-bucket transfer has been demonstrated from SIS18 into ESR for the first time with the new system. This first attempt was successful. All measurements have been done within one hour only and no quantitative measurements have been performed. The recording time of the bunch signals was only about 3.5ms which should be prolonged for future measurements. -- DietrichBeck - 9 June 2021

| I | Attachment | Action | Size | Date | Who | Comment |
|---|---|---|---|---|---|---|
| |
b2b-data_2021-may-17JPG.jpg | manage | 589 K | 07 Jun 2021 - 15:07 | DietrichBeck | |
| |
image_162938_b2b-trapping-efficiency.png | manage | 1 MB | 04 Jun 2021 - 15:51 | DietrichBeck | pickup signals; best vs worst rf-phase |
| |
reproducability_phi289-gap650.png | manage | 278 K | 07 Jun 2021 - 13:27 | DietrichBeck |
Edit | Attach | Print version | History: r9 < r8 < r7 < r6 | Backlinks | View wiki text | Edit wiki text | More topic actions
Topic revision: r9 - 04 Nov 2021, DietrichBeck
- Toolbox
-
 Create New Topic
-
 Index
Index
-
 Search
-
 Changes
-
 Notifications
-
 RSS Feed
-
 Statistics
-
 Preferences
Ideas, requests, problems regarding Foswiki? Send feedback