2021-Feb-21: 'Old' Timing Generator
Table of Contents
Introduction
The b2b system was operated 'dry' in parallel to standard machine operation for bunch to coasting beam from SIS18 to ESR from 20-21 February 2021. The b2b system measures the output of the kicker electronics (= signal firing the kickers) in both kicker rooms. From this, three sets of data are extracted.
- SIS18 extraction kick: offset between 'electronics out' signal and preceding rising edge of SIS 18 h=1 group DDS
- ESR injection kick: offset between 'electronics out' signal and preceding rising edge of SIS 18 h=1 group DDS
- delay between the two kicker 'electronics out' signals
The measurements help to give some insight into the performance of the existing 'old' timing generator.
Setup
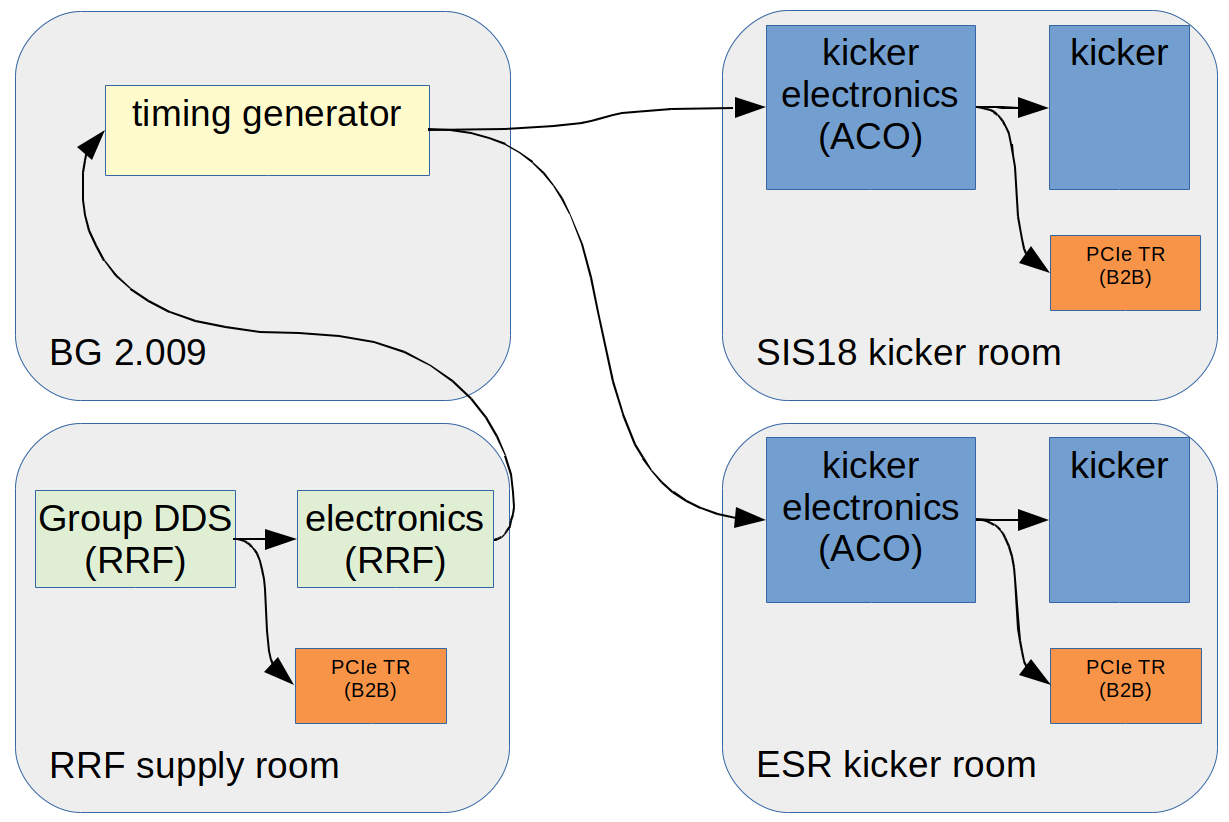 Figure:
 Setup. Shown are rooms (grey boxes), timing generator (yellow box), rf equipment (green boxes), kicker equipment (blue boxes) and nodes of the b2b system (orange boxes). The nodes of the b2b system are interconnected via the White Rabbit network (not shown). This figure shows the setup, when the kickers are triggered via the timing generator and the b2b system is just measuring in 'dry' mode.
The timing generator locks to an RF signal that is generated by electronics in the RRF supply room. The output of the timing generator is connected to the inputs of electronics in the kicker rooms. Three nodes of the b2b system serve to timestamp signals from the h=1 Group DDS and the output of the kicker electronics. NB: The kicker electronics includes a delay generator. The value of the delay is set in ParamModi via the value 'kicker-offset'.
Data
The data of 1436 transfers was considered in the analysis. Please note, that all three graphs have identical binning, width of x-axis and range of y-axis.
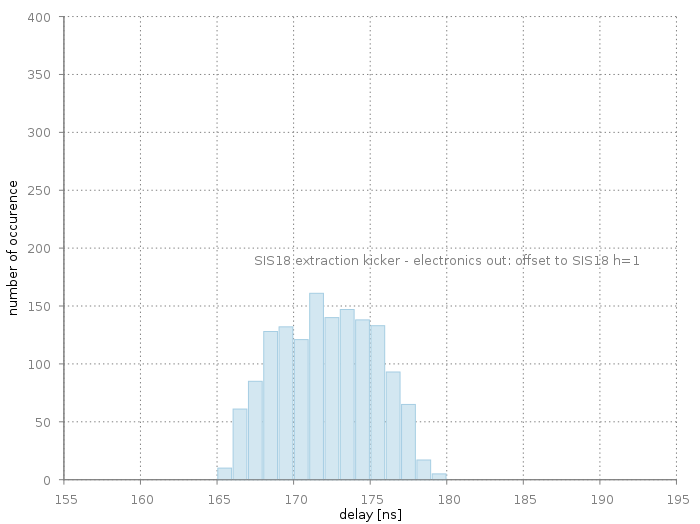 Figure:
 Distribution of kicks. The x-axis provides the offset from the preceding rising edge of the SIS18 h=1 Group DDS. The bin width is 1 ns.
Statistics:
- 1436 data points
- maximum: 179 ns
- minimum: 165 ns
- average: 172.0 ns
- std dev: 3.2 ns
- corr std dev: 3.0 ns
- FWHM: ~ 9 ns
The corrected standard deviation has been obtained by quadratic subtracting a value of 1.0 ns for the standard deviation of the SIS18 kicker electronics, see
here.
ESR Injection Kick
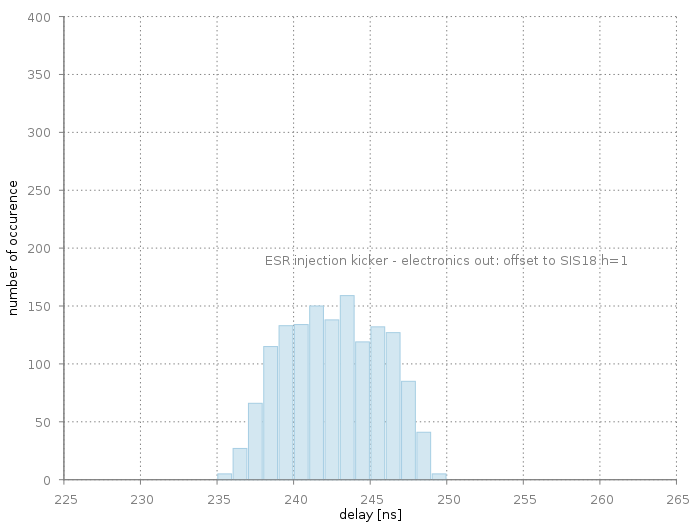 Figure:
 Distribution of kicks. The x-axis provides the offset from the preceding rising edge of the SIS18 h=1 Group DDS. The bin width is 1 ns.
Statistics:
- 1436 data points
- maximum: 249 ns
- minimum: 235 ns
- average: 242.4 ns
- std dev: 3.2 ns
- corr std dev: 3.0ns
- FWHM: ~9 ns
The corrected standard deviation has been obtained by quadratic subtracting a value of 1.0 ns for the standard deviation of the SIS18 kicker electronics, see
here.
Kick Delay
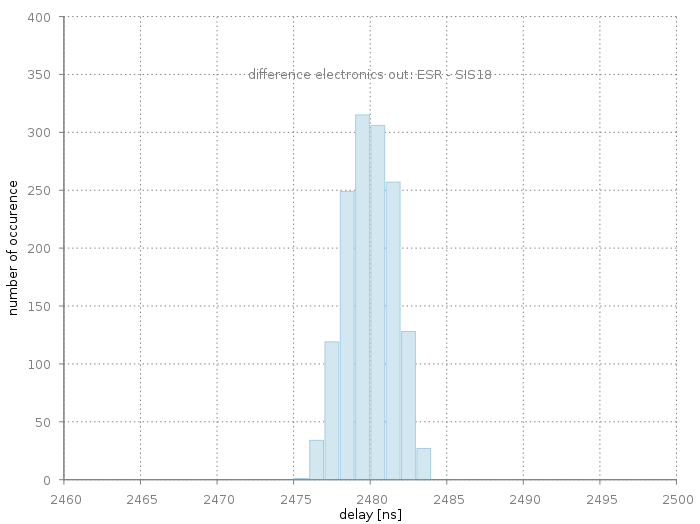 Figure:
 Distribution of kick delay between ESR and SIS18. Shown is the delay of the kicker electronics output in the ESR kicker room to the one in the SIS18 kicker room. The bin width is 1 ns.
Statistics:
- 1436 data points
- maximum: 2483 ns
- minimum: 2475ns
- average: 2479.5 ns
- std dev: 1.6 ns
- FWHM: ~4 ns
Discussion
Kick Distributions
The measured distributions of SIS18 and ESR kicks with respect to the SIS18 h=1 Group DDS signals show a fairly broad distribution with a FWHM of about 9ns. The following sources of uncertainties are considered.
'Jitter' of b2b system: Here, the b2b system is used as the measurement device. However, the precision of the b2b system is much better. It has been shown, that the b2b system is able to match h=1 signals with a precision of about 1ns, see
here and
here.
'jitter' of electronics in SIS18 / ESR kicker rooms: This has been measured in a
dry run in 2021 and is known to be in the order of ~3ns FWHM.
'jitter' of timing generator: The two above mentioned contributions can not explain the observed distribution. For now it is assumed that the 'old' timing generator adds the main contribution to the observed distributions.
While the observed distribution might be will suited with respect to kicker timing, the observed width is an indication that the 'old' timing generator has limited ability to match the bunch or bucket center: A FWHM of about 9ns is about 1% of a typical SIS18 revolution frequency. Thus, the precision of the 'old' system can be estimated to be in the order of 3% of the RF-phase. Thus, the old system does not meet the requirements of the upcoming FAIR facility, that request a precision of 1% or better.
Kicker Delay
During this measurement, the ParamModi settings for 'Kicker-Offset' are 4500 ns (ESR) and 2000 ns (SIS18). The expected value is 2500 ns and the measured mean value of ~2480ns is an almost perfect match and just 20ns 'too short'. As the b2b system is connected to the output of the kicker electronics with length matched cables, the missing 20 ns could be a systematic effect either in the kicker electronics, the timing generator or a difference in cable length. This is a really good result by the 'old' system.
It is interesting to see, that the distribution of the kicker delay is about half (with respect to FWHM and standard deviation) than the ones of the individual 'SIS18/ESR Kicks' of the first two measurements described above.
It can be speculated, if the observed distribution of the kicker delay can be explained by adding the previously
observed distributions quadratic. In this case, other uncertainties are excluded which demonstrates that the distribution of kicker signals via really long cables is done perfectly!
Uncertainties
It was tried to estimate the uncertainty of individual components. The standard deviation is used as a measure of the uncertainty as it can be computed easily from series of various data. The standard deviation of individual components is summarized in the table below.
| What |
standard deviation |
origin |
remark |
| h=1 Group DDS |
<< 0.1 ns |
RF group |
| b2b, RF triggered extraction |
0.3 ns |
oscilloscope |
measured in dry runs 2020 and 2021, 1 ns granularity |
| b2b, frequency beating |
0.5 ns |
oscilloscope |
measured in dry runs 2021 and 2021, 1 ns granularity |
| SIS18 kicker electronics |
1.0 ns |
b2b |
measured in dry run 2020 |
| SIS18 timing generator |
3.0 ns |
b2b |
this report |
Table: Uncertainties of different components given as standard deviation.
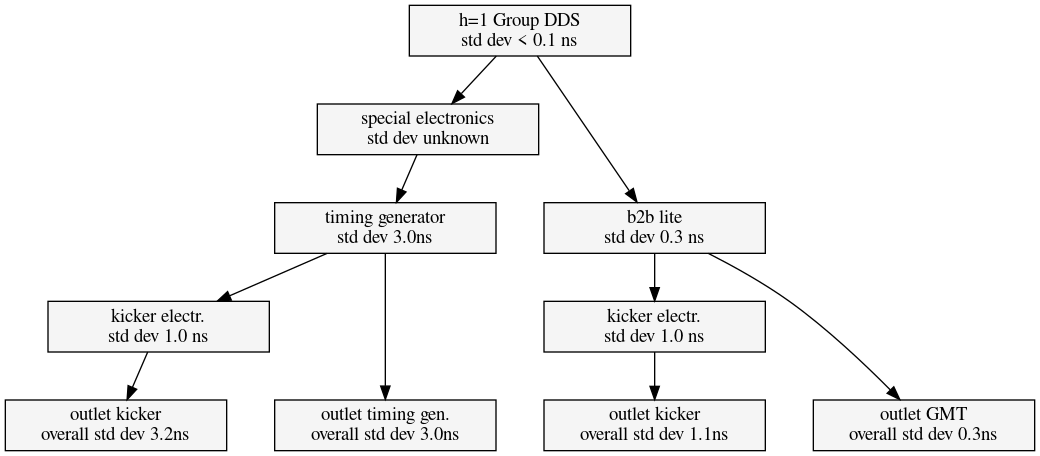 Figure:
 Estimated uncertainties added by individual components. Uncertainties are given as computed standard deviation. Overall uncertainties are obtained by quadratic adding of uncertainties.
Summary
It is expected that the new b2b will be able to narrow the observed distributions of 'SIS18/ESR Kicks' considerably to meet the requirements for the upcoming FAIR facility. Specifically, the b2b system would provide a better match with respect to the bunch and buckets centers. In terms of kicker timing, the 'jitter' of the kicker electronics itself will be the dominating uncertainty. However, it is assumed that the performance of the existing kicker electronics is by far sufficient and kicker electronics is not an issue.
Bonus
SIS18 Kicker Electronics Out and Magnet Probe
From 22-23 February 2021, the HHT experiment took beam from SIS18 at relatively high rate. The b2b system was operated 'dry' during the whole time. The aim was to get more data on the signals available in the kicker room and to additionally include the kicker magnet probe signal. The data presented here includes 3684 extractions from the ring towards HHT. The h=1 Group DDS frequency has been 1358533.883469 Hz (period 736.087640 ns) for all of the measurements; pattern SIS18_FAST_HHT_20210219_183613. The measuement setup is identical to the one described
here.
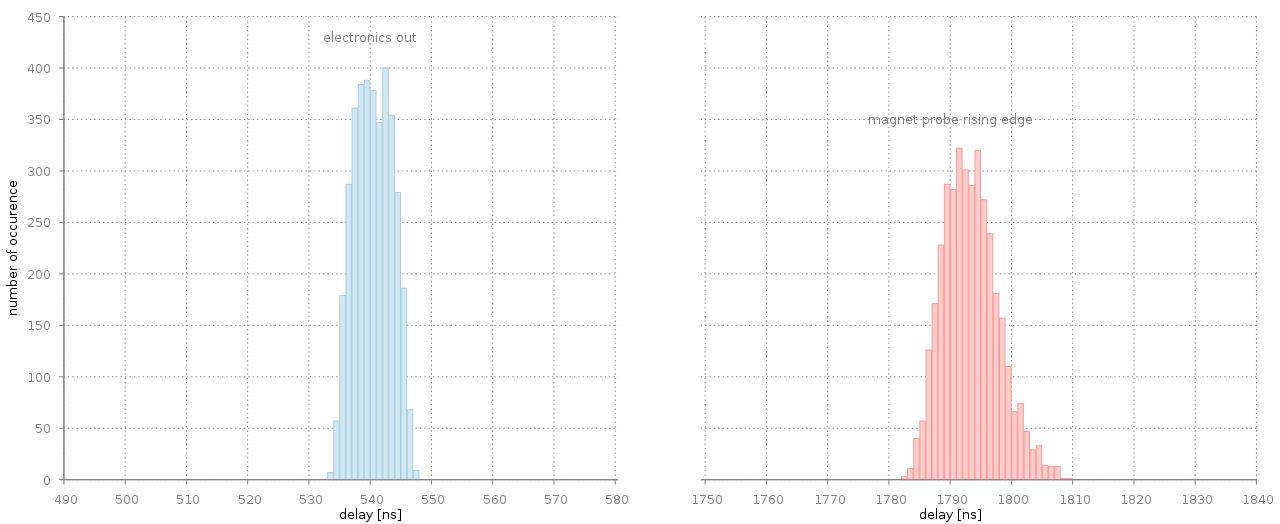 Figure:
 Delay of kicker electronics out (blue) and kicker magnet probe rising edge (red). The delay is measured from the preceding rising edge of the SIS18 h=1 Group DDS. Kicker electronics triggered by 'timing generator'. Bin width is 1ns. Please note: The scale of the x-axis is not continuous.
The figure above shows the delay of kicker electronics output and the rising edge of the magnet probe signals with respect to the preceding SIS18 h=1 group DDS signal. In principle, the first (blue) curve is similar to the ones above but with higher statistics.
The second (red) curve is the delay of of the rising edge of the capacitive coupler in the kicker room. The analog signal is converted into a LVTTL pulse by using a fast comparator built by the Experiment Electronics department. The red signal looks broader with a slight tail at the end.
In addition, the data of the magnet probe signal has been analyzed differently. This is shown in a third (green) curve below.
 Figure:
 Distribution of the rising edge of the kicker magnet probe signal. The x-axis marks the offset to the
preceding electronics out signal. The x-axis has the same scale as for the blue and red curve shown in a previous image. Bin width is 1 ns.
Here, the timestamp of the probe signal has not been compared to the rising edge of the h=1 Group DDS but to the output of the electronics in the kicker room. This eliminated the jitter/uncertainty of the 'timing generator' completely and the curve just shows the response of the magnet probe signal to the electronics output. While the scale of the x-axis is identical to the red curve of an previous image, the y-axis is at different scale as the green curve is narrower. However, the green curve has a 'tail' towards higher values, which is not fully understood.
It might well be, that this tail is not caused by the SIS18 extraction kicker itself, but is due to other effects: As an example, the same signal from the capacitive coupler is used by a variety of customers (main control room, beam instrumentation ...) and it might well be that the shape of the analog signal changed during the measurements reported here. Moreover the analog signal is known to be (sometimes) noisy. To conclude, the precision for detecting the rising edge of the magnet probe signal is certainly worse than the one for detecting the output signal of the kicker electronics.
Table: Statistics for signals measured with 'timing generator'.
SIS18 Kicker Timing vs EVT_KICK_START
The process of 'fast extraction' from SIS18 is started by the event EVT_KICK_START. As the RF-phase is undefined at this time, a so-called 'rf-triggered extraction' (GSI laboratory slang) must be done.
Standard Situation
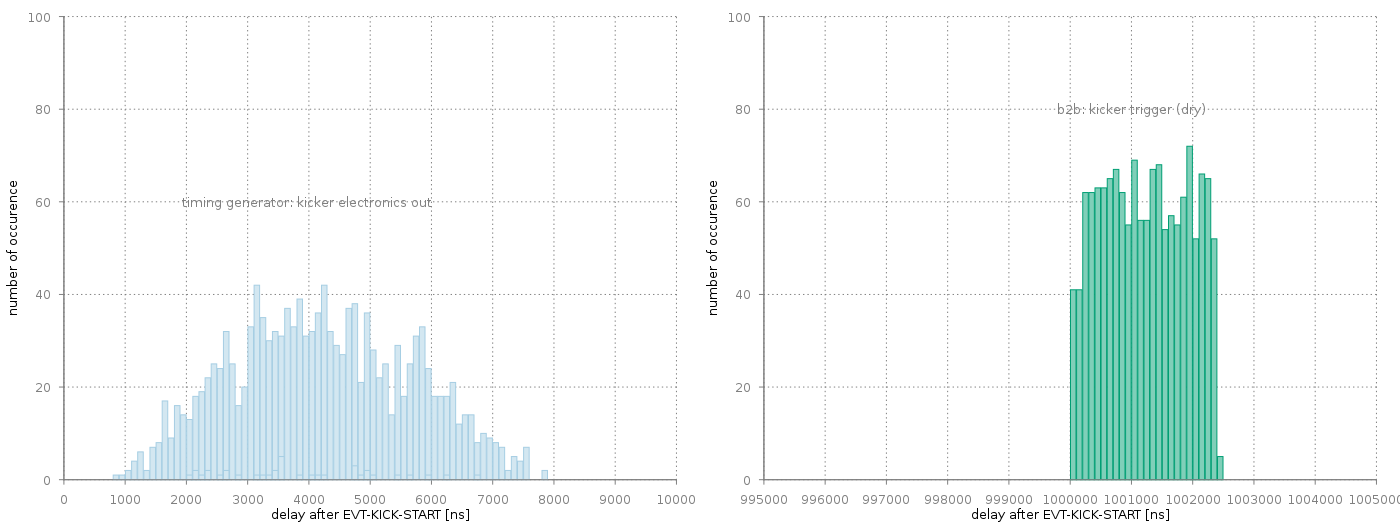 Figure:
 Delay of rf-triggered extraction with respect to EVT_KICK_START. Shown are 'timing generator' (left, blue) and b2b (right, green). The range of the x-axis and the scale of the y-axis are identical.
Bin width 100 ns.
Table: Statistics.
The figure above compares rf-triggered extraction of the b2b system and the timing generator. First of all, the 'timing generator' is much faster compared to the b2b system. This due to an intrinsic property of the b2b system, which must sent multiple messages via the White Rabbit network; the transmission time for each message is considered to have an upper-bound-latency of 500 us. The data has been taken for extraction from SIS18 at low energy. The revolution frequency in SIS18 at fast extraction has been 415 kHz (2.409 us revolution time).
The b2b system triggers the kicker at the soonest positive zero-crossing of the h=1 Group DDS following the full millisecond after EVT_KICK_START. Thus, all kicker triggers happen in a window from 1.0 ms to 1.0 ms + SIS18 revolution time; in this case: kicker triggers may happen from 1000.000 us to 1002.409 us after EVT_KICK_START. The observed window spans from 1000.001 us to 1002.406 us.
The timing generator has a broader distribution. Obviously, it does not alwasy trigger on the first RF-cycle, but it needs some time to sync to the rf signal. While the b2b system triggers within a window of one rf-cycle, the timing generator triggers within a windows of three rf-cycles.
Border Case: Fixed RF Phase at EVT_KICK_START
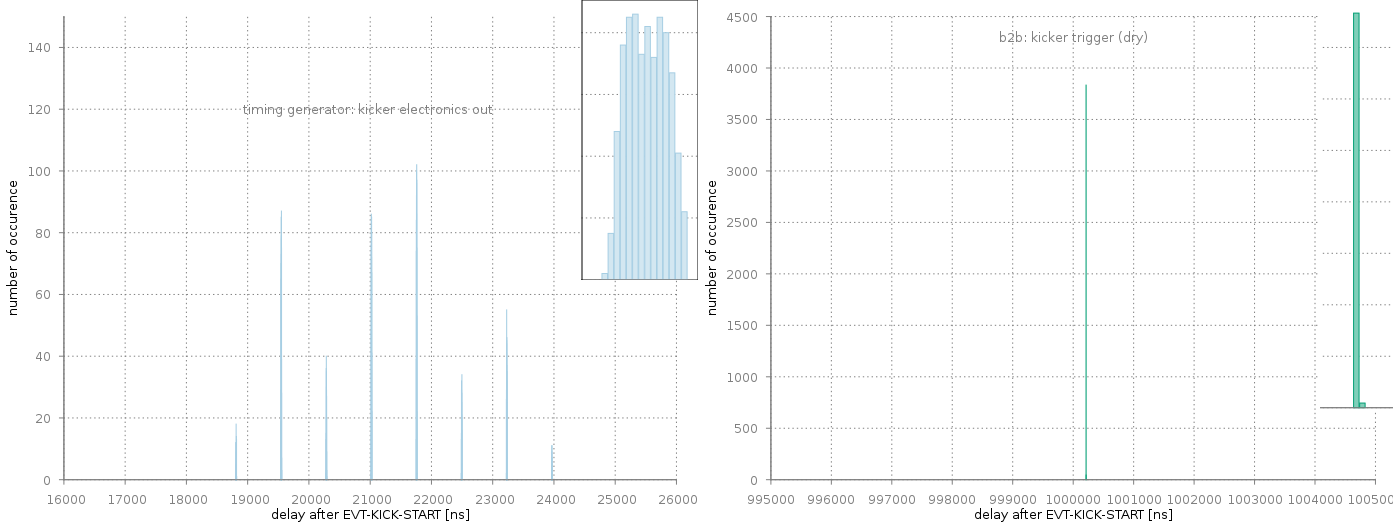 Figure:
 Delay of rf-triggered extraction with respect to EVT_KICK_START. Here, the rf-phase at EVT_KICK_START is fixed by a specific operation mode. Shown are 'timing generator' (left, blue) and b2b (right, green). The ranges of the x-axis are identical in both figures, but the y-axis has a
different scale. The small inserts (top right in both figures) show a more detailed histogram of the central peak.
Bin width 1 ns.
The figure above shows a a border case of a very specific situation. Here, the RF-phase at EVT_KICK_START is always constant (!) The revolution frequency in SIS18 at fast extraction has been 1348 kHz (0.736 us revolution time).
The b2b system triggers on the next rising edge after the full millisecond following EVT_KICK_START. As the rf-phase at EVT_KICK_START is constant, the b2b system always triggers at the same time, 95% of the data are in the same 1ns-bin.
The trigger distribution of the timing generator basically shows a 'comb'; the difference between the peaks equals the SIS18 revolution period of 736 ns. Obviously, the timing generator needs a variable number of rf-cycles for each extraction until it finally triggers. Interestingly, the average time required for synchronization is longer at higher frequencies (please compare with the standard case above).
B2B Self-Test
As a self-test, the b2b system performs a couple of diagnostic measurements. An example is a measurement, by how far the rising edge of the h=1 Group DDS signal differs from the prediction of the b2b system after a certain amount of time. Of course, this test must be done on flat-top, while the Group DDS frequency is still constant. Presently, this is done 20 ms (!) after the initial phase measurement at the
same Group DDS. In the ideal case, the deviation would be zero.
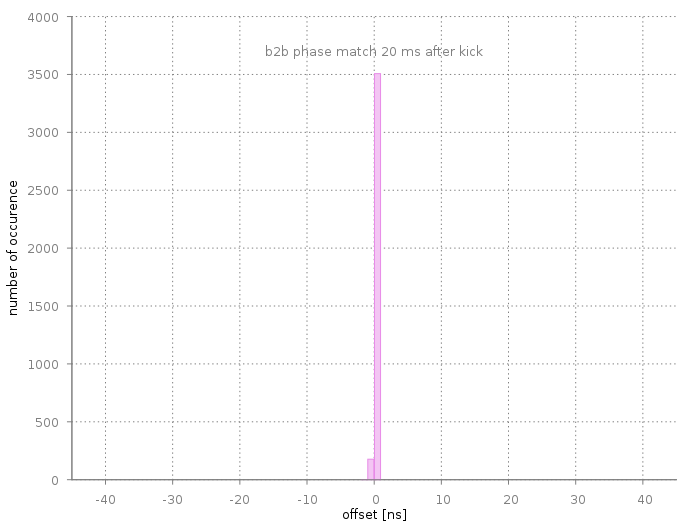 Figure:
 Difference of predicted and actual h=1 Group DDS signal 20 ms after the initial phase measurement. Bin width 1ns.
The result shown in the figure above includes data that were taken in parallel to the other kicker measurements in this section and are moreover included in the table above. More than 95% of the data are contained in the same 1 ns bin.
--
DietrichBeck - 25 Feb 2021


 Create New Topic
 Index
Index
 Search
 Changes
 Notifications
 RSS Feed
 Statistics
 Preferences