|
|
You are here: Foswiki>BunchBucket Web>BunchBucketDocumentation>BunchBucketDocuments>BunchBucketTestsMeasurements>BunchBucketTestMeasurement6 (19 Apr 2021, DietrichBeck)Edit Attach
2021-Apr-13: SIS18 Extraction Kicker with the Bunch-2-Bucket System
Table of ContentsIntroduction
On 13 April 2021, it was possible to perform a ~4 hour 'dry-run' with the B2B system at the SIS18 extraction kicker. This provided the opportunity to compare against a previous measurement with the 'old Timing Generator' (see here). The setup has not changed to previous measurements and is described here.SIS18 Kicker Electronics Out and Magnet Probe
The data presented here includes 2647 'dry' extractions from the ring. The h=1 Group DDS frequency has been 1374999.993 Hz (period 727.272731 ns) for all of the measurements.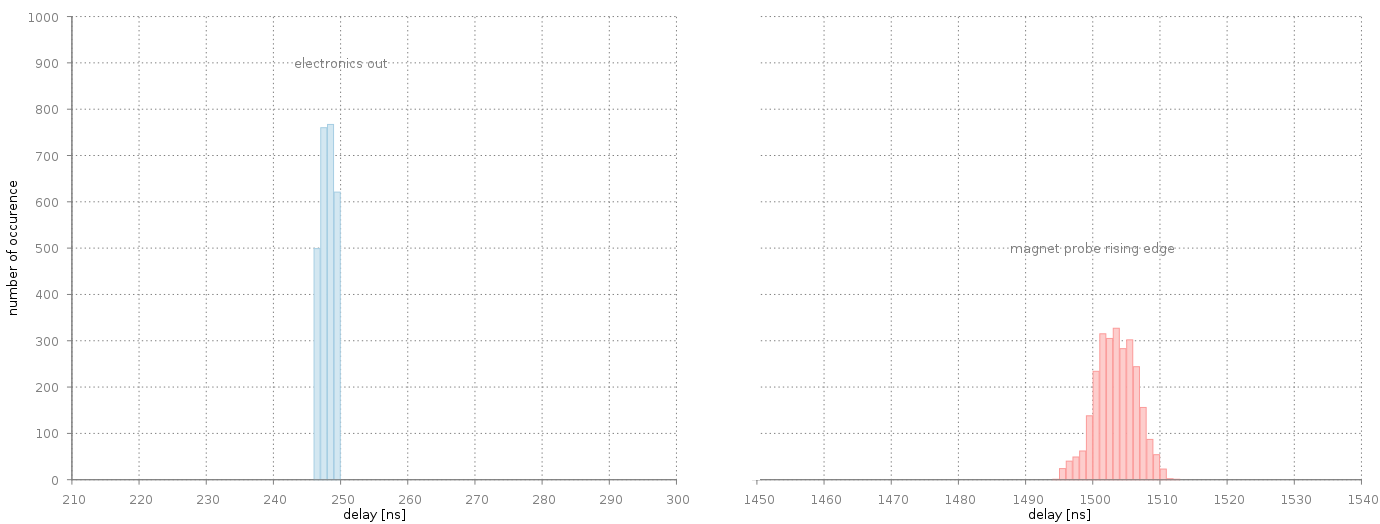 Figure: Delay of kicker electronics out (blue) and kicker magnet probe rising edge (red). The delay is measured from the preceding rising edge of the SIS18 h=1 Group DDS. Kicker electronics triggered by B2B. Bin width is 1ns. Please note: The scale of the x-axis is not continuous.
The figure above shows the delay of kicker electronics output and the rising edge of the magnet probe signals with respect to the preceding SIS18 h=1 group DDS signal. In principle, the first (blue) curve includes all of the data in just four nanosecond bins.
The second (red) curve is the delay of of the rising edge of the capacitive coupler in the kicker room. The analog signal is converted into a LVTTL pulse by using a fast comparator built by the Experiment Electronics department. The red signal is broader.
In addition, the data of the magnet probe signal has been analyzed differently. This is shown in a third (green) curve below.
Figure: Delay of kicker electronics out (blue) and kicker magnet probe rising edge (red). The delay is measured from the preceding rising edge of the SIS18 h=1 Group DDS. Kicker electronics triggered by B2B. Bin width is 1ns. Please note: The scale of the x-axis is not continuous.
The figure above shows the delay of kicker electronics output and the rising edge of the magnet probe signals with respect to the preceding SIS18 h=1 group DDS signal. In principle, the first (blue) curve includes all of the data in just four nanosecond bins.
The second (red) curve is the delay of of the rising edge of the capacitive coupler in the kicker room. The analog signal is converted into a LVTTL pulse by using a fast comparator built by the Experiment Electronics department. The red signal is broader.
In addition, the data of the magnet probe signal has been analyzed differently. This is shown in a third (green) curve below.
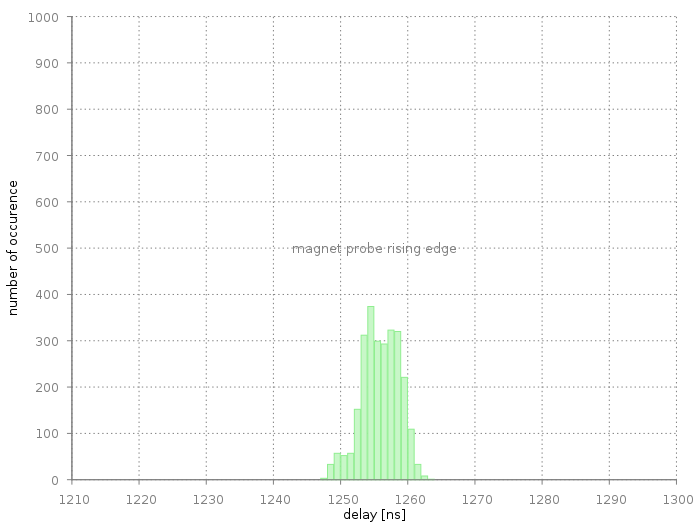 Figure: Distribution of the rising edge of the kicker magnet probe signal. The x-axis marks the offset to the preceding electronics out signal. The x and y-axis have the same scale as for the blue and red curve shown in a previous image. Bin width is 1 ns.
Here, the timestamp of the probe signal has not been compared to the rising edge of the h=1 Group DDS but to the output of the electronics in the kicker room. This eliminates the jitter/uncertainty of the B2B system and the kicker electronics completely and the curve just shows the response of the magnet probe signal to the electronics output.
Compared to the red curve in the previous image, the shape of the distribution is basically identical. Thus, the jitter of the kicker electronics as well as the B2B system do almost not contribute to the width of the distribution. As a speculation, the shape of the distribution is not caused by the SIS18 extraction kicker itself, but is due to other effects: As an example, the same signal from the capacitive coupler is used by a variety of customers (main control room, beam instrumentation ...) and it might well be that the shape of the analog signal changed during the measurements reported here. Moreover the analog signal is known to be (sometimes) noisy. To conclude, the precision for detecting the rising edge of the magnet probe signal is certainly worse than the one for detecting the output signal of the kicker electronics.
Figure: Distribution of the rising edge of the kicker magnet probe signal. The x-axis marks the offset to the preceding electronics out signal. The x and y-axis have the same scale as for the blue and red curve shown in a previous image. Bin width is 1 ns.
Here, the timestamp of the probe signal has not been compared to the rising edge of the h=1 Group DDS but to the output of the electronics in the kicker room. This eliminates the jitter/uncertainty of the B2B system and the kicker electronics completely and the curve just shows the response of the magnet probe signal to the electronics output.
Compared to the red curve in the previous image, the shape of the distribution is basically identical. Thus, the jitter of the kicker electronics as well as the B2B system do almost not contribute to the width of the distribution. As a speculation, the shape of the distribution is not caused by the SIS18 extraction kicker itself, but is due to other effects: As an example, the same signal from the capacitive coupler is used by a variety of customers (main control room, beam instrumentation ...) and it might well be that the shape of the analog signal changed during the measurements reported here. Moreover the analog signal is known to be (sometimes) noisy. To conclude, the precision for detecting the rising edge of the magnet probe signal is certainly worse than the one for detecting the output signal of the kicker electronics.
| Signal | Min [ns] | Max [ns] | Average [ns] | Std Deviation [ns] | # of data | # of SIS18 cycles | Std Deviation with 'Timing Generator' [ns] | |
|---|---|---|---|---|---|---|---|---|
| electronics out | 246.2 | 249.2 | 247.8 | 1.0 | 2647 | 2651 | 3.0 | |
| magnet probe rising edge delay | 1494.2 | 1512.2 | 1503.1 | 3.0 | 2647 | 2651 | 4.5 | |
| magnet probe rising edge offset | 1247.0 | 1263.0 | 1255.4 | 2.8 | 2647 | 2651 | 3.3 | |
Reliability
As shown in the table above, 2647 successful extractions by the B2B system have been recorded within 2651 SIS18 cycles. Thus, in four cases neither a monitor nor a magnet probe signal from the SIS18 kicker have been detected within the accepted time window. It is unknown, if the four 'missing shots' are due to a failure in the kicker electronics or kicker control frontend or if this is due to other reasons. In none of the four cases the B2B system detected any other error (RF, communication, White Rabbit ...).Comparison with 'Timing Generator'
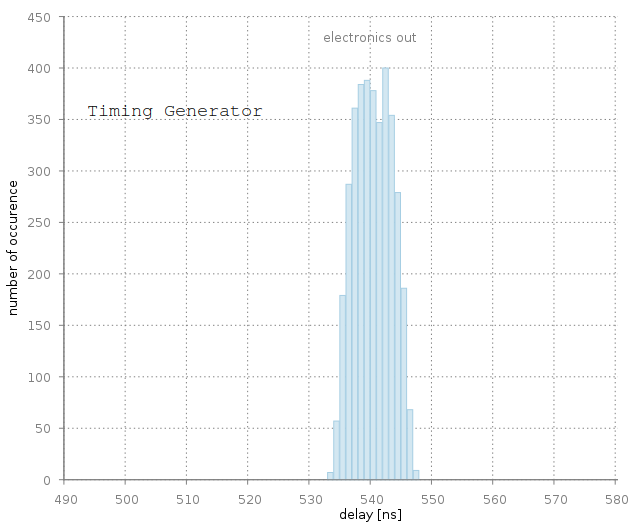 Figure: Previously measured distribution of the rising edge of the kicker magnet probe signal using the 'Timing Generator'. Bin width is 1 ns.
A similar measurement has been done by using the old 'Timing Generator' (see here). With timing generator, the observed distribution is a factor of three broader. Please compare with the blue distribution shown in the previous section.
-- DietrichBeck - 18 Apr 2021
Figure: Previously measured distribution of the rising edge of the kicker magnet probe signal using the 'Timing Generator'. Bin width is 1 ns.
A similar measurement has been done by using the old 'Timing Generator' (see here). With timing generator, the observed distribution is a factor of three broader. Please compare with the blue distribution shown in the previous section.
-- DietrichBeck - 18 Apr 2021


| I | Attachment | Action | Size | Date | Who | Comment |
|---|---|---|---|---|---|---|
| |
b2e_sis18-monitor-out_timing-generator.png | manage | 41 K | 18 Apr 2021 - 14:11 | DietrichBeck | delay monitor with timing generator |
| |
b2e_sis18_delay-mon-probe_2021-04-13.png | manage | 54 K | 18 Apr 2021 - 11:35 | DietrichBeck | delay monitor out and magent probe to h=1 |
| |
b2e_sis18_delay-probe_2021-04-13.png | manage | 39 K | 18 Apr 2021 - 11:35 | DietrichBeck | delay magnet probe |
Edit | Attach | Print version | History: r3 < r2 < r1 | Backlinks | View wiki text | Edit wiki text | More topic actions
Topic revision: r3 - 19 Apr 2021, DietrichBeck
- Toolbox
-
 Create New Topic
-
 Index
Index
-
 Search
-
 Changes
-
 Notifications
-
 RSS Feed
-
 Statistics
-
 Preferences
Ideas, requests, problems regarding Foswiki? Send feedback