January 2021: Dry Run
Table of Contents
Introduction
In January 2021 the B2B system was tested during a dry run. The following new features have been deployed and tested.
- bunch-to-bucket with frequency beating method
- multiplexed operation
- SIS18 and ESR are independent of each other
- up to 16 transfers 'in parallel'
- of course: separate set-values and get-values
- phase measurement: added frequency measurement of H=1 group DDS
- 20ms after EVT_KICK_START
- ~100 mHz precision after one transfer; ~10 mHz precision after multiple transfers
- ESR kicker magnet probe
- acquire signals for injection AND extraction
- additional hardware has been installed
- comfortable command line interface for configuration
- 1st version of command line interface for monitoring
Setup
See
here.
Log
| date |
time |
what |
remark |
| 2021-01-11 |
|
SIS18 and ESR kicker connected to B2B |
 |
| 2021-01-13 |
|
final deployment of firmware, software and configuration |
 |
| 2021-01-14 |
|
'parallel' operation of RF triggered extraction from SIS18 including kicker |
 |
| 2021-01-15 |
08:00 |
broken SIS18 H=1 group DDS replaced by RF goup |
 |
| |
10:30 |
SIS18 kicker switched from B2B to 'old' timing generator |
 |
| |
10:35 |
H. Liebermann tested ParamModi 'kicker-offset' with timing generator |
 |
| |
10:40 |
SIS18 kicker switched from 'old' timing generator to B2B |
 |
| |
11:30 |
coupled pattern SIS18 -> ESR available |
 |
| |
13:45 |
broken ESR H=1 group DDS replaced by RF goup |
 |
| |
13:50 |
B2B with frequency beating SIS18 (H=4) to ESR (H=2) |
 [1] [1] |
| |
14:15 |
added extraction from ESR to CRYRING beamline |
 |
| |
14:30 |
tested tuning of relative RF phase between H=1 group DDS signals |
 |
| |
14:45 |
tested shifting of extraction kicker timing relative to SIS18 group DDS |
 |
| |
14:50 |
tested shifting of injection kicker timing relative to SIS18 group DDS |
 |
| |
14:50 |
tested various beating periods from 250us to 20ms |
 |
| |
17:00 |
stop testing features, start stability test of a few hours |
 |
| 2021-01-20 |
|
firmware with fixed phase measurement tested |
 |
Table: Log of beam time. Hours are tentative. [1]: There is an issue with phase measurements at higher frequencies.
Issues of the Present System
Various issues have been identified and are summarized below. Most importantly, the instability of phase measurements at higher frequencies needs to be fixed.
Phase Measurement Unstable at 'Higher' Frequencies
This is THE main issue and not yet fully understood. From time to time, the phase measurement fails. This seems to happen only for H=1 frequencies at ~1.2 MHz and higher. Most likely, this is a problem with the phase measurement firmware of the B2B system.
Update: This is fixed, see
here.
Missing Group DDS Signals at Beam Time Preparation
We had this issue already in the previous dry run: Group DDS signals are in general only available when the facility is in operation. Hence, it is impossible to verify the B2B system is ready for operation unless the beam time starts and the system is actually required. All DDS modules of the Ring RF systems should be supplied with frequency ramps even when the machine is not operated. Ideally, the frequency ramps are always present (not only during dry-runs) such that long-term tests, diagnostics and maintenance of LLRF and the B2B system is possible when the accelerator is not operated. This will increase the availability of all components and systems..
Indexing by Sequence ID for Get-Values
Another solution for indexing Get-Values must be found.
Frequency Detuning via ParamModi
The beating method requires a slight detuning of the higher harmonic RF frequencies. ParamModi only allows set this via the parameter 'Frequenzverstimmung' in units of dp/Extr [%]. It is a bit cumbersome to work out a value for specific beating frequency.
Late Events with Large Beating Frequencies
The B2B system calculates when the Group DDS H=1 signal match at the specified phase difference. However, the system must consider the propagation time of messages in the White Rabbit network. A present, we assume a propagation time of 500us. In case the 'match' happens earlier than 500us into the future, this might result in a so-called 'late event' and the kickers will not fire on-time. The present contingency strategy is to add one full beating period. This strategy might fail if the beating period is shorter than 500us. However, this issue is considered a border case and will be addressed, once the feature of selecting individual bunches/buckets will be implemented.
Remote Monitoring
The oscilloscope in the RF supply in BG 1.016 is very useful for specific measurements, but provides a limited set of information only. A simple command line tool has been developed that allows to monitor the B2B system. This program can run on any front end at GSI connected to the ACC and White Rabbit networks. It provides a rich set of information and allows to monitor the system remotely. The first version still suffers from a few issues.
'Dont Worry We'll Test It In Production'
Mainly due to missing missing equipment, there is only
one B2B system available, which is of course used in the PRO environment. In fact, it was only possible to setup the PRO system cannibalizing equipment of a previously existing test system. There are no spares except for the kicker rooms.
Of course, there is a separate dedicated development system.
Results
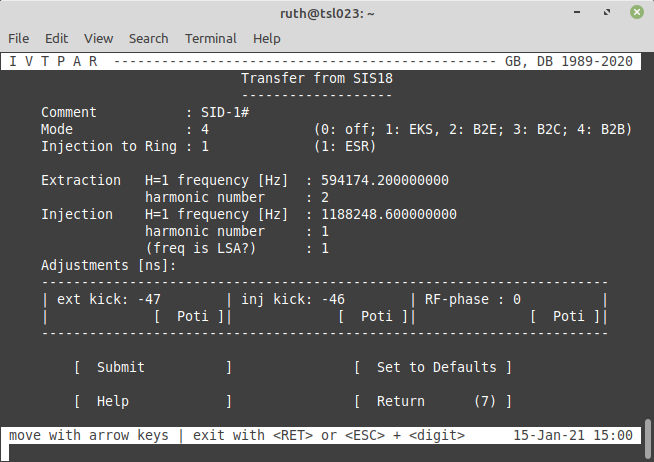 |
transfer starts with extraction from SIS18 |
| 'SID-1', these settings are for Sequence ID 1 |
| 'Mode 4', bunch 2 bucket transfer and injection to ESR |
| H=1 frequencies and harmonic numbers of extraction and injection |
| the frequency values are LSA values (entering the raw DDS values is also possible) |
| adjustments for the kickers and rf-phase of the injection ring [1] |
Figure: Command line control interface. [1]: All adjustments are relative to the rising edge of the H=1 Group DDS signal of the extraction ring. The
[ Poti ] knobs allow comfortable trimming of parameters using < Page Up/Down > keys.
The command line control interface is shown above. As an example, the configuration for Sequence ID 1 (SID-1) for SIS18 at a beating frequency for 100ms (SIS18: H=2, ESR: H=1) is shown.
All following oscilloscope screenshots depict the following traces.
- channel 1, yellow, SIS18 H=1 Group DDS signal
- channel 2, magenta, ESR H=1 Group DDS signal
- channel 3, cyan, ESR injection trigger signal
- channel 4, green, SIS18 injection trigger signal
Both H=1 Group DDS signals are connected to the oscilloscope using length match BNC cables of about 12m length. Both kicker trigger signals are connected to the oscilloscope length matched cables of about 2m length. This 10m difference in cables length causes a delay of the H=1 signals. For easier comparison on the oscilloscope, the B2B system adds a offset of -47ns to the kicker trigger times, which roughly compensates the signal propagation time in 10m cables.
For all figures of the oscilloscope screen, the following three sets of measurement data are shown.
Matching of SIS18 Kicker Trigger and H=1 Group DDS Signals
The b2b lite system does not only predicts when matching of the two Group DDS signals of two rings is achieved. Moreover, the system aims at predicting the rising edges of the H=1 signals with hight precision. This is a important feature as it allows to trigger the kickers directly: With respect to precise timing of the kickers, the so-called 'Trigger Decision Module' is not required. This requires the b2b system to match kicker trigger signals to the H=1 signal (the precision must be sufficient to 'hit the bunch gap') On the oscilloscope, the precision can be estimated from the first measurement 'skew (C1,C4)'.
Matching of SIS18 and ESR H=1 Group DDS Signals
This is what the beating method is about. Both signals must be matched with the required precision. On the oscilloscope, the precision can be estimated from the second measurement 'skew (C1,C2)'.
Matching of SIS18 and ESR Kicker Trigger Signals
The b2b system schedules the execution time of both signals relative to the H=1 group signal of the extraction machine. Thus, the time difference of both signals only depends on the applied correction values but not on any of the rf signals. Basically, the time difference of both signals is just a performance check of the White Rabbit timing system as well as the oscilloscope. The standard deviation of signal differences of two timing receivers is expected to be in 2 digit picosecond range.
 |
|
| name of ring |
| |
| Status sequence ID, Mode, # of extractions |
| list of required and received messages as well as errors |
| |
| Set Values. |
| 1st line; kicker correction, frequency and period H=1 group DDS [1], harmonic number |
| |
| |
| |
| Get Values. |
| 1st line; measured delay of kicker electronics and kicker magnet probe |
| 3rd line; skew between kicker trigger and measured H=1 group DDS signal |
| B2B Diagnostics. |
| 1st line; skew between expected and measured H=1 group DDS signals |
| 3rd line; same as 1st line but in units of degree instead of ns |
| RF Diagnostics. |
| 3rd line; measured frequency of H=1 group DDS |
| 4th line; estimated frequency of H=1 group DDS [2] |
| 5th line; proposed unambiguous LSA value |
Figure: Fast extraction from SIS18. Left: Screenshot monitoring. Right: Legend. [1]: The set value of the group DDS differs from the LSA value by up to 46 mHz. [2]: Closest possible DDS value.
The figure above shows fast extraction from SIS18 @ 905 kHz revolution after more than 1500 extractions. The first line of
Get Values shows the skew between the extraction kicker trigger and the SIS18 H=1 Group DDS, similar to a figure of an oscilloscope (see
here). Shown are the value of the
act ual extraction (0ns),
mean of all extractions (-0.496 ns) and
standard deviation (0,594). The reliability of the system can be estimated from the
min (-2 ns) and max (0 ns). values. The demonstrates the system is working reliably and stable. In this example, the beating frequency (SIS18: H=2, ESR: H=1) is set to 50Hz.
A second phase measurement is performed after 20ms. This allows a measure the actual frequency of the H=1 Group DDS on the flat top and the values are displayed in the section
RF Diagnostics. After about 18000 RF periods, measured and expected rising edges of the H=1 Group DDS signal deviate by 363ps, which results in deviation of 16 mHz between measured and 'true' H=1 signal. Still, the deviation of is significantly larger than the standard deviation which indicates a systematic effect. Most likely, this is an artifact from the 1ns resolving power of the measurement itself.
Bunch-2-Bucket SIS18 to ESR
Figure: First Bunch-2-Bucket signals from at the GSI facility (SIS18 -> ESR). Shown are monitoring (left) and oscilloscope (right). For colors and assignment of oscilloscope traces see top of this section.
The figures above shows the very first bunch to bucket transfer using the new b2b system. On the oscilloscope, the scatter between the two H=1 signals is 316 ps (standard deviation) and 1.2 ns (maximum observed deviation). On the monitoring screen, these values can be found in the section 'B2B Diagnostics' in the line entitled 'B2B phase [ns]', here the values are slightly larger 519 ps (standard deviation) and 2 ns (maximum observed deviation); this can easily be explained by the fact, that the resolving power of the oscilloscope is superior.
For accelerator operation SIS18 was operated at H=4 (ESR: H=2) with a beating frequency of 100Hz. If we require the H=1 signals to match, the feature of counting bunches and buckets is required. However, this feature is not yet implemented in the b2b system. As a temporary solution, the b2b system was set to H=2 for SIS18 (H=1 for ESR) with halved beating frequency.
Tuning/Corrections
The present b2b provides three 'free' parameters.
- offset extraction kicker timing (must 'hit' the bunch gap)
- offset injection kicker timing (required when injecting into another ring)
- offset H=1 signal injection ring
All offsets are independent of each and relative to the rising edge of the H=1 signal of the extraction machine!

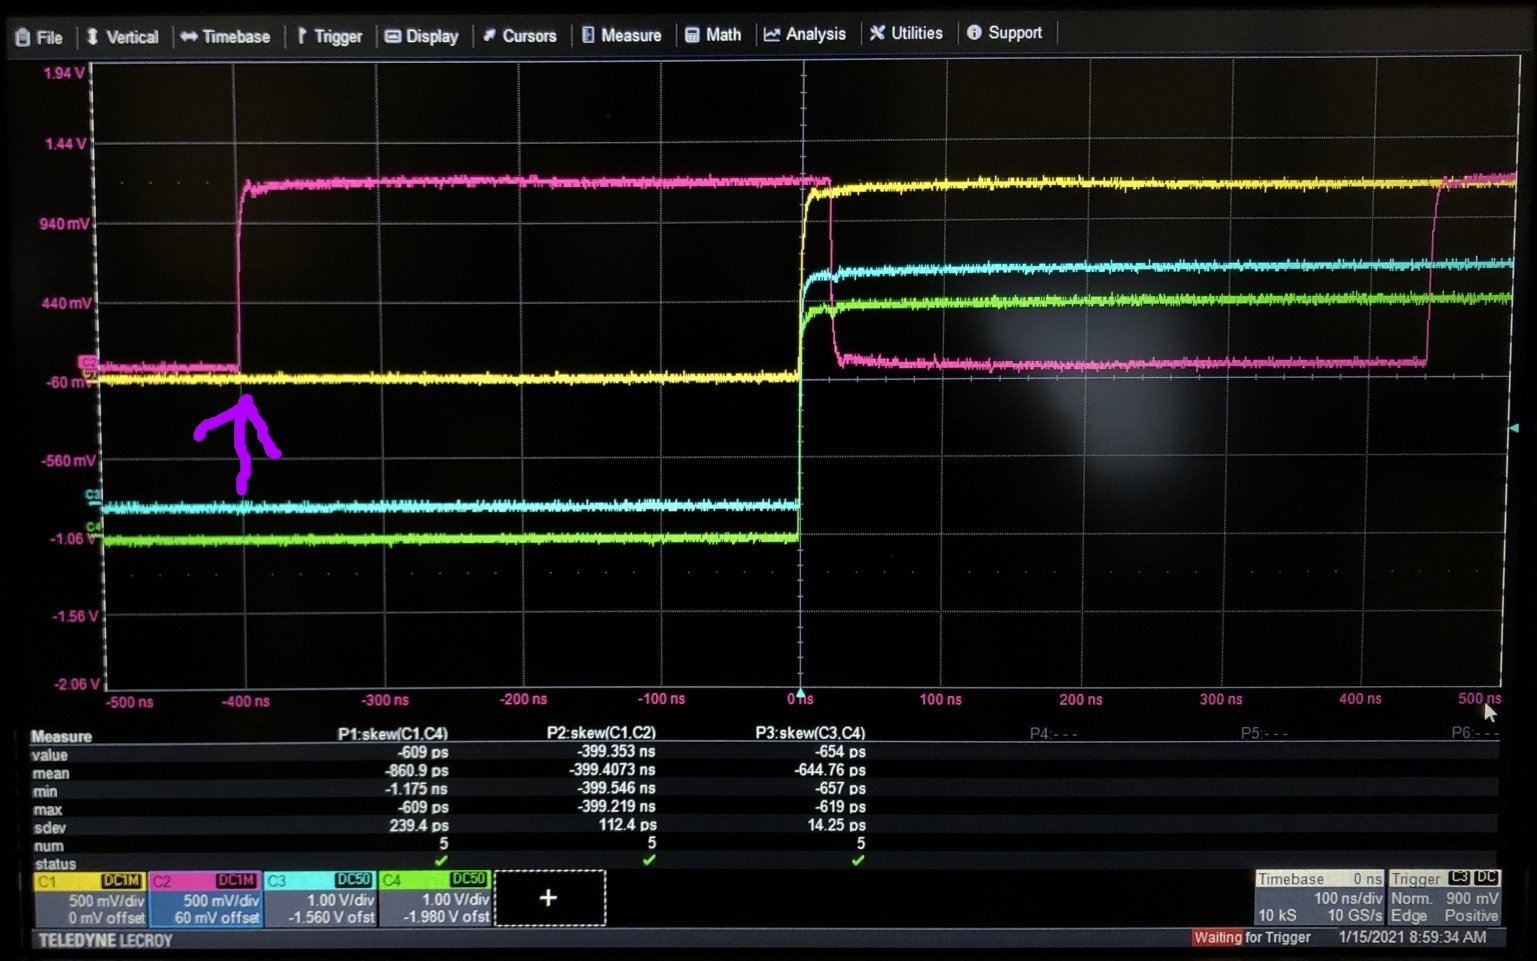 Figure:
 Offsets applied to the H=1 signal of ESR (period 840ns). Offset +400 us (top), offset -400 us (bottom).
As an example, the figure above demonstrates changing the relative phase between the two H=1 Group DDS signals. Please note, that this does not affect the timing of the kickers that can be changed independently.
Analysis and Discussion
Precision
| SIS18 H=1 [Hz] |
ESR H=1 [Hz] |
SIS18 H=4 [Hz] |
ESR H=2 [Hz] |
T_beat [ms] |
# of transfers |
mean [ns] |
SDev [ns] |
Sdev [°] |
max diff [ns] |
max diff [°] |
| 594174.163 |
1186346.682 |
2376696.652 |
2372693.364 |
00.25 |
51 |
1.335 |
0.609 |
0.130 |
2.309 |
0.493 |
| 594174.163 |
1187847.974 |
2376696.652 |
2375695.948 |
01.00 |
37 |
0.879 |
0.419 |
0.090 |
1.721 |
0.368 |
| 594174.163 |
1188248.582 |
2376696.652 |
2376497.164 |
05.01 |
42 |
0.628 |
0.274 |
0.059 |
1.117 |
0.239 |
| 594174.163 |
1188298.456 |
2376696.652 |
2376596.912 |
10.03 |
37 |
0.607 |
0.314 |
0.067 |
1.444 |
0.309 |
| 594174.163 |
1188322.902 |
2376696.652 |
2376645.804 |
19.67 |
53 |
0.588 |
0.292 |
0.062 |
1.150 |
0.246 |
| |
|
|
|
|
|
|
|
|
|
| 594174.163 |
1188322.902 |
2376696.652 |
2376645.804 |
19.67 |
1321 |
0.589 |
0.330 |
0.070 |
1.736 |
0.371 |
Table: Columns 1..6 show the relevant settings of the measurement. The given frequencies are DDS values, not LSA values. Column 7..11 show the difference of the H=1 signals. As a measure for the scatter, the standard deviation and the maximum difference are given in nanoseconds and degree. The last row repeats the measurement at 20 ms beating frequency at higher statistics.
Column 7 of the table above shows the difference (t
ESR - t
SIS18) between the rising edges of the two H=1 signals for various beating periods from 250us to 20ms at given RF frequencies and harmonic numbers. Although statistics and number of transfers are limited by the given beam time, a some trends can be derived tentatively.
- the ESR signal is always later than the SIS18 signal; this is due to the phase matching algorithm
- the difference between the signals increases, when the beating time is reduced; this is expected as the difference between periods of the two signals becomes larger
- standard deviation and the max difference increases, when the beating time is reduced
- except the two measurements with the short beating times, the maximum difference of the two H=1 signals is always below 1.5 ns
- last row: even after 1321 transfers (~ 8 hours of operation) the maximum difference between the two H=1 signals is only 1.7 ns.
A phase measurement of a H=1 signal is the timestamp of one of the rising edges. A White Rabbit timing receiver allows timestamping in 1 ns bins. As matching the RF signals of both rings requires two phase measurements, one can roughly estimate the total uncertainty by adding the uncertainties of both measurements quadratic ally. As a first estimate, a phase measurement is assumed to have a Gaussian distribution with 1 ns FHWM. Thus, a FWHM of
sqrt(2) * 1 ns = 1.4ns is reasonable for the distribution of phase difference around a mean value. In fact, the 1ns granularity of the White Rabbit time stamps is the dominating factor except for the two measurements with short beating times and one can conclude the following:
- BuTiS and White Rabbit clocks are very well locked to each other; in fact, the results tend to become even better for longer beating times
- as even the maximum difference of the two H=1 signals is within the expected uncertainty, other systematic effects seem to be smaller than the statistical uncertainty of the measurements
Failure of Phase Measurement at 'Higher Frequencies'
Phase measurements of the SIS18 Group DDS @ 908 kHz can be performed reliably, see
above. However, this is not always the case for phase measurements at the ESR Group DDS at frequencies of ~1.2 MHz and above. As an example, for a total of 1419 transfers, only 1321 phase measurements at ESR succeeded. Thus, only 1 out of 13 phase measurements failed. The reason is not understood and investigating this issue has highest priority. As a first guess, this has to do with the way the phase measurement is done in the firmware; in this case it can be fixed easily.
Update 2021-Jan-20: Issue with Phase Measurement Fixed
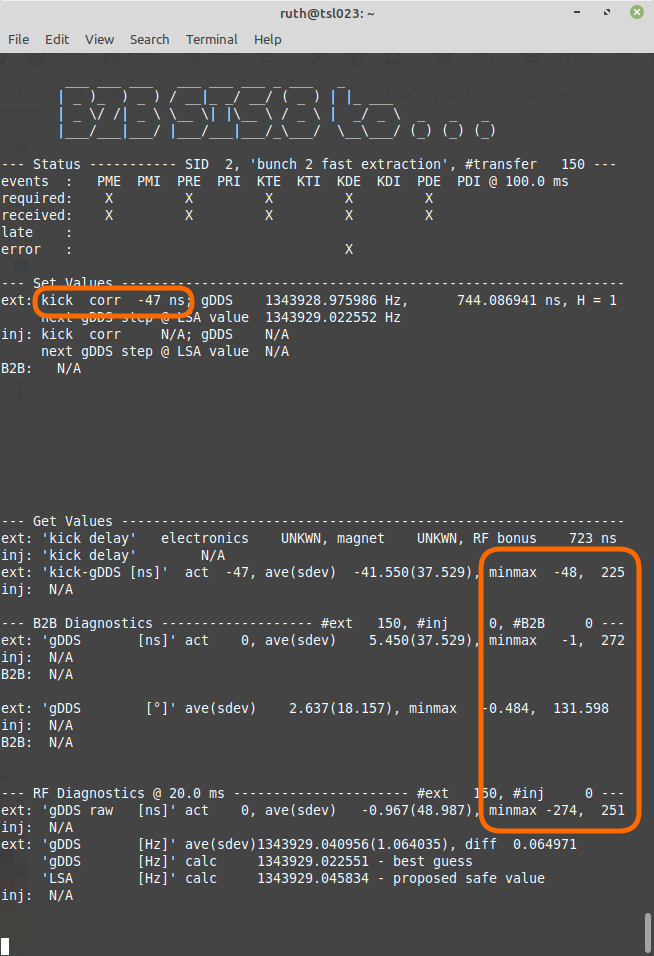
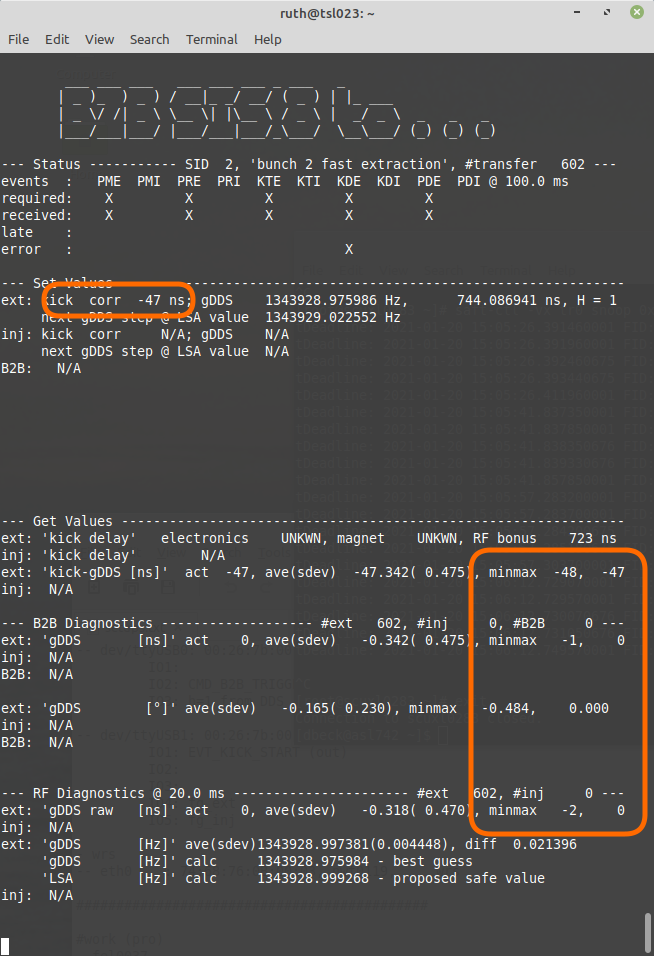
On 20 January 2021, a new firmware with a fix for the phase measurement issue has been ready. Two tests were performed in the productive GSI facility. A pattern with protons @ 300GeV/u from SIS18 to HHT is used; revolution frequency of SIS18 at flat top is 1.34 MHz. The B2B system was set for 'RF triggered extraction' from SIS18. Two tests were performed at identical settings of the facility. One test with the old firmware, another test with the new firmware. For both tests, the extraction kicker timing was adjusted with an offset of -47 ns.
Figure: Left: Phase measurement with issues. Right: Phase measurement with fix. Relevant numbers are indicated by orange boxes. The small orange box (upper left) marks the adjustment of -47 ns for the extraction kicker timing. The large orange box (right) shows the maximum deviation of the values for the entire measurement time. Details see text.
expected values
- 'Get Values': min and max values around -47 ns
- 'B2B Diagnostics': min and max values close to 0 ns
- 'RF Diagnostics': min and max valules close to 0 ns
measured values for firmware with issue
- 'Get Values': min -48 ns (ok), max 225 ns (bad)
- 'B2B Diagnostics': min -1 ns (ok), max 272 ns (bad)
- 'RF Diagnostics': min -274 ns (bad), max 251 ns (bad)
The measurement for the old firmware (left) includes data for 150 extractions. The problem is obvious.
measured values for new firmware
- 'Get Values': min -48 ns (ok), max -47 ns (ok)
- 'B2B Diagnostics': min -1 ns(ok), max 0 ns (ok)
- 'RF Diagnostics': min -2 ns (ok), max 0 ns (ok)
Although the measurement of the new firmware includes already 600 extractions, no erroneous phase measurement is observed

.
The phase measurement problem is fixed.
Conclusion
- things seem to work well, if the phase measurement of the H=1 Group DDS signal succeeds
- the stability of the phase measurement must be improved; this issue has been identified and is already fixed by a new firmware
- the reliability of the online monitoring tool should be improved
--
DietrichBeck - 20 January 2021


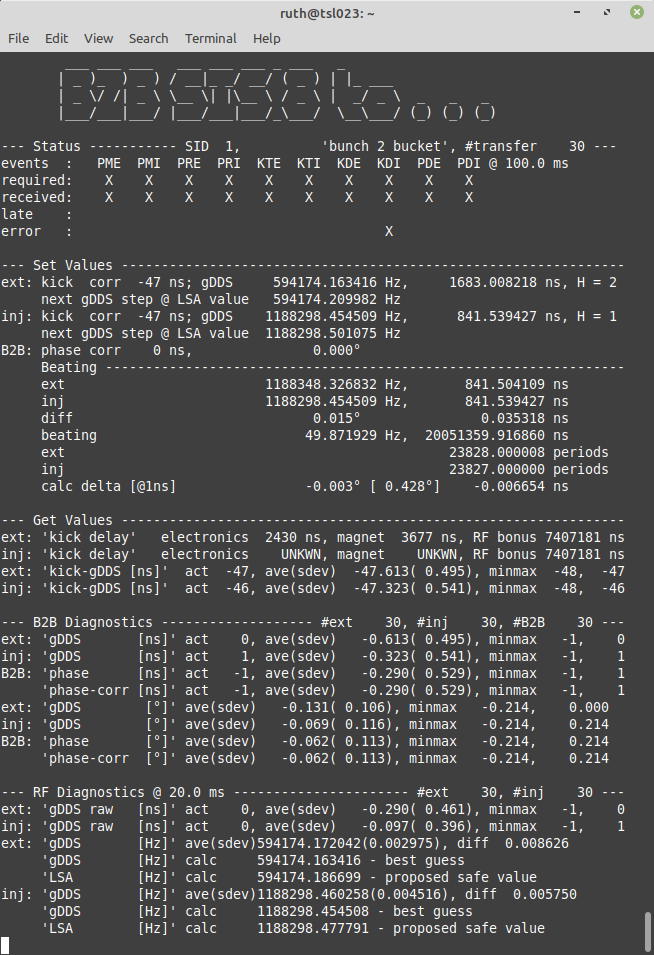


 Figure: Offsets applied to the H=1 signal of ESR (period 840ns). Offset +400 us (top), offset -400 us (bottom).
As an example, the figure above demonstrates changing the relative phase between the two H=1 Group DDS signals. Please note, that this does not affect the timing of the kickers that can be changed independently.
 Create New Topic
 Index
Index
 Search
 Changes
 Notifications
 RSS Feed
 Statistics
 Preferences
 Copyright © by the contributing authors. All material on this collaboration platform is the property of the contributing authors.

