You are here: Foswiki>FESA Web>Fesa3version1>FESA3nextCodeSnippets100>Fesa3LoggingPolicy (11 Nov 2022, TobiasHabermann)Edit Attach
Logging in FESA
Overview
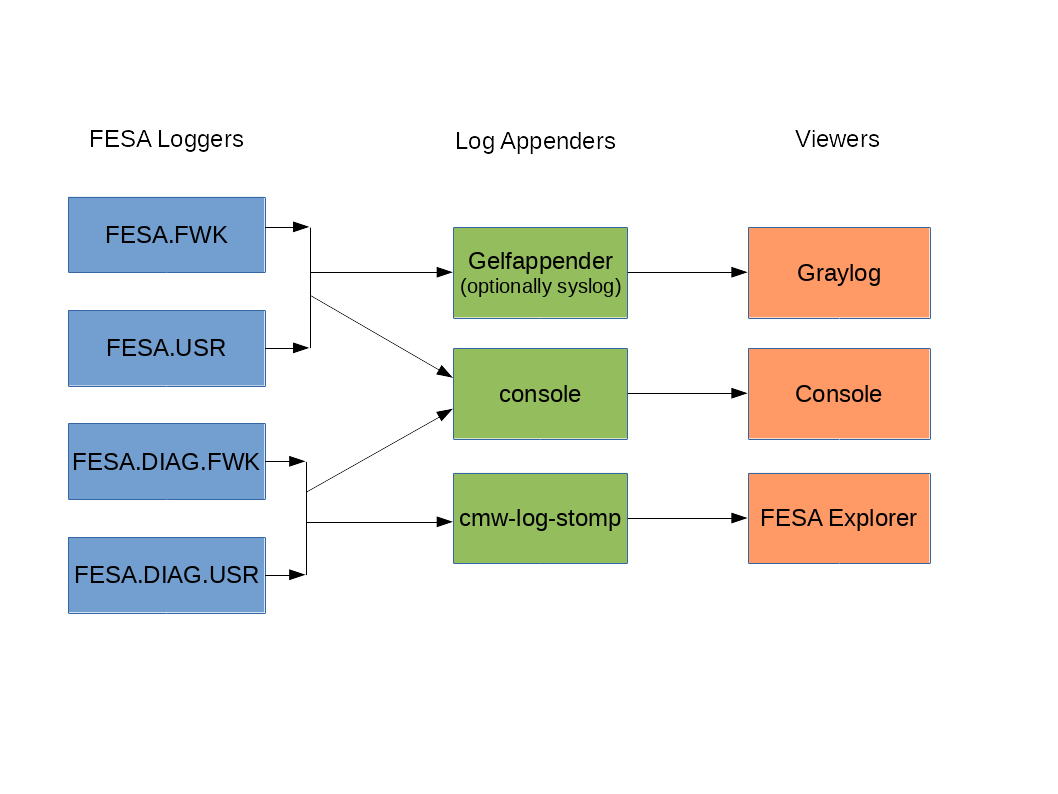
In FESA a selection of diffent loggers is available. Each C++ class has its own logger. All loggers are identified by their name which is usually identical with the C++ class name. In order to be able to filter and redirect the different log-messages in a proper way, the prefix of the names of the loggers is standardized:- General Logging ( granularity can be controlled during startup only)
- FESA.FWK : logged by the framework ( fesa-core, fesa-core-gsi )
- FESA.USR : logged by the FESA class developer
- Diagnostic Logging ( granularity can be controlled at runtime)
- FESA.DIAG.FWK : All informational messages which fit into one of the diag-fwk-topics, logged by the FESA framework
- FESA.DIAG.USR : All informational messages which fit into one of the diag-custom-topics, logged by the FESA class developer
 If required, it is possible to reconfigure the message routing in the file "log.cfg". Which log.cfg to use can be passed to a FESA binary as application argument during start. You can find the standard logging configuration file at: "/opt/fesa/fesa-core-gsi/[FESA-Version]/log.cfg". To change the log level for FESA.USR log messages adapt the parameter
# Standard-Logging for class-developers. Per default logs WARNING and all above
logger.FESA.USR.level = WARNING
in a custom copy of the standard logging configuration file. To use the custom logging configuration file use the application argument -cfglog <path to custom log configuration file>. For more detailed information on how to configure logging via the logging configuration file please refer to the services group. Per default the FESA Loggers FESA.FWK and FESA.USR only log warnings and errors. The verbosity can be configured either in the file log.cfg, or by passing application arguments to FESA:
- -v : verbose, log everything with the level "debug" and higher
- -vv : very verbose, log everything with the level "trace" and higher
- LL_AUDIT = 60, ///< A special level that can be used to turn off all logging, apart from audit logs.
- LL_ERROR = 50, ///< A message level indicating a serious problem.
- LL_WARNING = 40, ///< A message level indicating a potential problem.
- LL_INFO = 30, ///< A message level for information messages.
- LL_DEBUG = 20, ///< A message level providing debugging information.
- LL_TRACE = 10 ///< A message level providing highly detailed tracing information.
General Logging
- Should be used by class developers in order to log errors and warnings
- Is enabled by default for errors and warnings
- Since as well all FESA-FWK internal logs use the general logging, it is recommended to not use the general logging for LOG_TRACE, etc. ( your log viewer will be flooded by FESA FWK log messages )
std::ostringstream message;
message << "Place your log message here" ;
LOG_ERROR_IF(logger, message.str());
// Depending on the level of your log message you can use of the following macros:
// LOG_TRACE_IF(logger, message.str());  // In FESA classes you should use the diagnostic-logging instead
// LOG_DEBUG_IF(logger, message.str());  // In FESA classes you should use the diagnostic-logging instead
// LOG_INFO_IF(logger, message.str());   // In FESA classes you should use the diagnostic-logging instead
// LOG_WARNING_IF(logger, message.str());
// LOG_ERROR_IF(logger, message.str());
The CMW logger object
Each FESA source file contains generated code to create a cmw Logger object specifically for that source file:cmw::log::Logger& logger = cmw::log::LoggerFactory::getLogger("FESA.USR.MyClass.RealTime.MyAction");
This creates a logger named "FESA.USR.MyClass.RealTime.MyAction" (or retrieves it if it exists already). The LOG_DEBUG_IF (etc) macros use this logger object.
This allows access to loggers defined in other files / projects.
Setting Log Level in Code
To change the log level at runtime:logger.setLevel(cmw::log::Level::LogLevel::LL_DEBUG); cmw::log::Level::LogLevel = logger.getLevel();
Separate Framework and User Log Levels on SCU
Using the -v/-vv arguments will show both User and Framework messages. It is possible to select only user trace messages by changing log.cfg/common/export/fesa/local/scuxl????/Class_DU/log.cfg: logger.FESA.USR.level = TRACE logger.FESA.USR.level = WARNINGNote that log.cfg wil be overwriten during a new deployment.
General Logging - Viewer: Graylog
For information on using Graylog to view log messages see: https://www-acc.gsi.de/wiki/FESA/UsingGraylogGeneral Logging - Viewer: Console
If the FESA binary is launched via the start script, all messages from the general logging will be displayed on the related console.General Logging - stdout/stderr
If the FESA binary is launched via the manual start script, stdout and stderr will be shown on the console only. If the FESA binary is launched via the daemon start script, stdout will not be shown and stderr will be redirected to graylog. Messages sent to logging via stderr are not guaranteed to arrive in one piece or in the correct order so avoid using stderr for production systems.Diagnostic Logging
- Can be used by class developers in order to debug a running FESA class
- Some framework topics can be used by default
- FESA class specific topics can be added by the FESA class developer
   <custom-types>
                ....
      <diag-custom-topic name="DIAG_TOPIC">
         <b0 name="StartupPowerSupply" />
         <b1 name="Ramping" />
         <b2 name="ShutdownPowerSupply" />
         <b3 name="MY_DIAG_TOPIC" />
      </diag-custom-topic>
   </custom-types>
In your code you can now make use of the defined topics like that:
LOG_DIAG_IF("StartupPowerSupply","MyDiagMessage");
LOG_DIAG_IF("ShutdownPowerSupply","SomeOtherDiagMessage");

// Via the DiagnosticProperty, messages of specific devices can be enabled/disabled
// So if a message is device specific, the following Makro should be used:
LOG_DIAG_DEVICE_IF("ShutdownPowerSupply","SomeOtherDiagMessage",(*device));
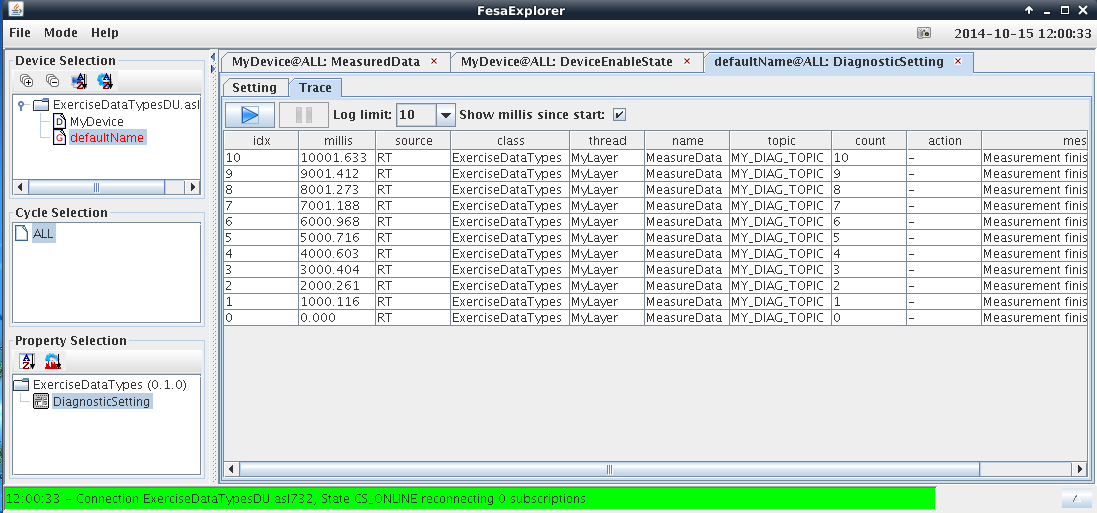
Diagnostic Logging - Viewer: FESA Explorer
During runtime of the FESA binary it is possible to enable / disable each log topic in the FESA Explorer: All messages for the specified topic filter can now be observed

Diagnostic Logging - Viewer: Console
If the FESA binary is launched via start script, all messages from enabled diagnostic-channels will be displayed on the related console.Diagnostic Logging - Dis/enable in Code
The diagnostic logging can be dis-/enabled similar to general logging via the logger namedFESA.DIAG:cmw::log::LoggerFactory::getLogger("FESA.DIAG").setLevel(cmw::Log::Level::LL_AUDIT);
Alternatively, per class diagnostic logging can be en/disabled via (here only Side::user):
auto tops = fesa::AbstractEquipment::getInstance()->getDiagnostics()->getTopics(DiagnosticsDefs::Side::user,"ClassName");
for(const auto& top : tops) {
    if (enable) {
        fesa::AbstractEquipment::getInstance()->getDiagnostics()->enable(DiagnosticsDefs::Side::user,top.second,"ClassName");
    } else {
        fesa::AbstractEquipment::getInstance()->getDiagnostics()->disable(DiagnosticsDefs::Side::user,top.second,"ClassName");
    }
}
Logging in CMW
Logging is also performed independently of FESA by the CMW middleware, recording RDA sets and optionally gets and subscriptions. The log level can be set in log.cfg, the default is "logger.cmw.level=WARNING".What is logged by cmw-rda3-cpp by loglevel
| Log Level | Logged |
| Audit (60) | RDA-SET |
| Info (30) | RDA-GET RDA-SUBSCRIBE |
| Debug (20) | RDA-UNSUBSCRIBE |
Contents of CMW log messages
CMW log messages show the client connection and request context information: RDA-SET device="DEVICENAME" property="PropertyName" client="user@host/pid" applicationId="app=appname;uid=user;host=hostname;pid=processid;" framework="RDA3" context="RequestContextImpl[selector=; filters=; data=]" The contents of the RDA data container are not shown.| I | Attachment | Action | Size | Date | Who | Comment |
|---|---|---|---|---|---|---|
| |
FEX_Logging1.png | manage | 32 K | 15 Jan 2015 - 13:35 | AlexanderSchwinn | |
| |
FEX_Logging2.png | manage | 36 K | 15 Jan 2015 - 13:36 | AlexanderSchwinn | |
| |
Overview.jpg | manage | 69 K | 11 Nov 2022 - 11:06 | TobiasHabermann | |
| |
Overview.odp | manage | 14 K | 11 Nov 2022 - 11:06 | TobiasHabermann |
Edit | Attach | Print version | History: r19 < r18 < r17 < r16 | Backlinks | View wiki text | Edit wiki text | More topic actions
Topic revision: r19 - 11 Nov 2022, TobiasHabermann
 Copyright © by the contributing authors. All material on this collaboration platform is the property of the contributing authors.
 Ideas, requests, problems regarding Foswiki? Send feedback


