You are here: Foswiki>IN Web>Services>DiagnosticLogging (26 Oct 2023, ChristophHandel)Edit Attach
Diagnostic Logging System
The diagnostic logging services is provided by acoinn by running a opensearch, opendashboards, logstash cluster to receive and store diagnostic logging messages.Guidelines
- consult acoinn before logging to this cluster
- do not permanently send debug messages
- there is an automatic logfile retention
Usage
Connections
- DNS name is logging.acc.gsi.de
- IP is 140.181.188.24
- UDP Receivers are active for syslog (514) and gelf (12201)
open dashboards
open dashboards is a webinterface for opensearch. As such it is not primarily focused on log data, but should be good for our use cases.Archive Browser
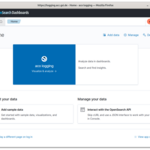
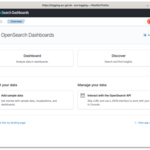
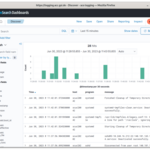
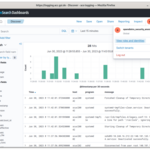
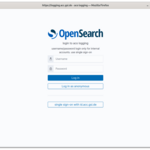
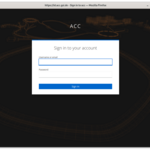
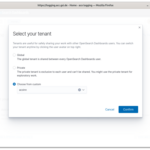
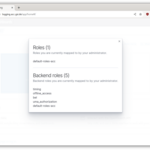
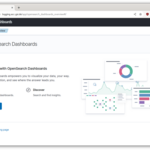
A Webinterface is available at https://logging.acc.gsi.de/ By default users are logged in as anonymous users with read only access. Click on the big blue "Visualize & analyze" and then on "Discover". This brings up a default search window. Trying to save a query will fail for the anonymous user. You can check the current account on the top right corner. If you log out a login dialog will show. Do not use username and password (these are only for internal usage). Either use anonymous, or single sign-on. Which will bring you to the id management of aco (see also SingleSignOn). If your browser is already logged in to id management, you will automaticly be logged in. Notice in the top right that the user changed. An authenticated user has access to multiple tenant, switching tenants is done via the user menu. You can check your roles using the user menu (top right) and selecting "View roles and identities". Roles are the permission sets assigned to you within opensearch. The role default-roles-acc should alweays be assigned, for each tenent a role gsi-tenant-... is assigend. Backend roles list your group memberships as assigned by the acc identity management system. These are mapped to the opensearch roles. For further information see the opensearch dashboards documentation available at https://opensearch.org/docs/2.8/dashboards/index/ A lot of dashboards features are not available to "normal" users. Unfortunately these can't be hidden. So if you get a forbidden error, that is most likely intended.index pattern
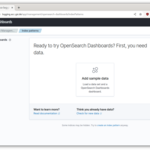
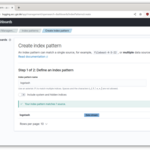
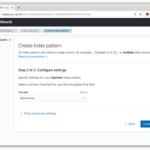
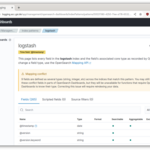
If you first use a shared or your private tenant you won't see any data after clicking the big blue aco logging button, only a Getting started. Opensearch requires an index pattern. Select "Add Data", ignore the sample data und select the "create an index pattern" at the bottom. The index pattern name is logstash, which will match excactly one source which is the data stream logstash. the time field is @timestamp. Then we have a mapping conflict because different loggers use different value types for the same field, but the index is ready for use. If you return to the start page (home icon) you can go to visualize and then discover.Live Viewer
Log tail is available on ClusterAcc9 withopensearch tail --host myhost or opensearch tail --program mydeployunit
Syslog Emitter (c, c++, etc.)
Any process can output syslog format to logging.acc.gsi.de:514CMW Log Emitter
evaluation of a native gelf emitter for cmw log (used by fesa) is provided by acoserJava Emitter
use the acoapp common dependencies package. see: https://git.acc.gsi.de/fcc-commons/common-dependencies/src/branch/master/src/main/resources for webservices/servlets add an additional dependency on log4j-web and specify servlet context parameter log4jConfiguration to switch logging configs.python emitter
use python standard logging and GelfUdpHandler from the pygelf logger (https://github.com/keeprocking/pygelf)Example
from pygelf import GelfUdpHandler
import logging

gelfHandler = GelfUdpHandler(host='logging.acc.gsi.de', port=12201, _my_static_field = "myData")
logger = logging.getLogger()
logger.setLevel(logging.INFO)
logger.addHandler(gelfHandler)
logger.info('hello gelf')
Message fields
logging has active input pipelines parsing syslog fields, timestamps, modify hostnames, etc. -- ChristophHandel - 30 Jun 2023Edit | Attach | Print version | History: r8 < r7 < r6 < r5 | Backlinks | View wiki text | Edit wiki text | More topic actions
Topic revision: r8 - 26 Oct 2023, ChristophHandel
 Copyright © by the contributing authors. All material on this collaboration platform is the property of the contributing authors.
 Ideas, requests, problems regarding Foswiki? Send feedback

