|
|
You are here: Foswiki>BunchBucket Web>BunchBucketDocumentation>BunchBucketDocuments>BunchBucketSlowControl (14 Jul 2021, DietrichBeck)Edit Attach
Slow Control and Monitoring
Table of ContentsIntroduction
The B2B system is a fairly simple device with a few inputs and outputs connected via interface boards with FPGA. The only difference is that those interface boards are not interconnected via a SCU-bus backplane but via the White Rabbit network service as low latency realtime field bus with upper bound latency. Data supply is done only via a the Central B2B Unit (CBU). Acquisition of get values can in principle be done via any Timing Receiver on the White Rabbit network. Writing the set-values to the CBU is simple and straight-forward. The CBU is small lm32 firmware and shared library provides an interface to higher level applications. Reading the get-values is even simpler. It does not even require B2B specific code, but only a subscription to timing messages via the saftlib. At the time of this writing (March 2021) a simple command line interface (CLI) has been developed for supply with set-values. What turned out to be more challenging is the analysis and supply of get-values. A first approach was a 2nd CLI similar to the one for set-values. However, this turned out to grow further and further, became unmanageable and was soon retired to the garbage bin. Thus acquisition, processing and display of get-values has been replaced by a more modular approach.Topology
Control and On-Line Diagnostic
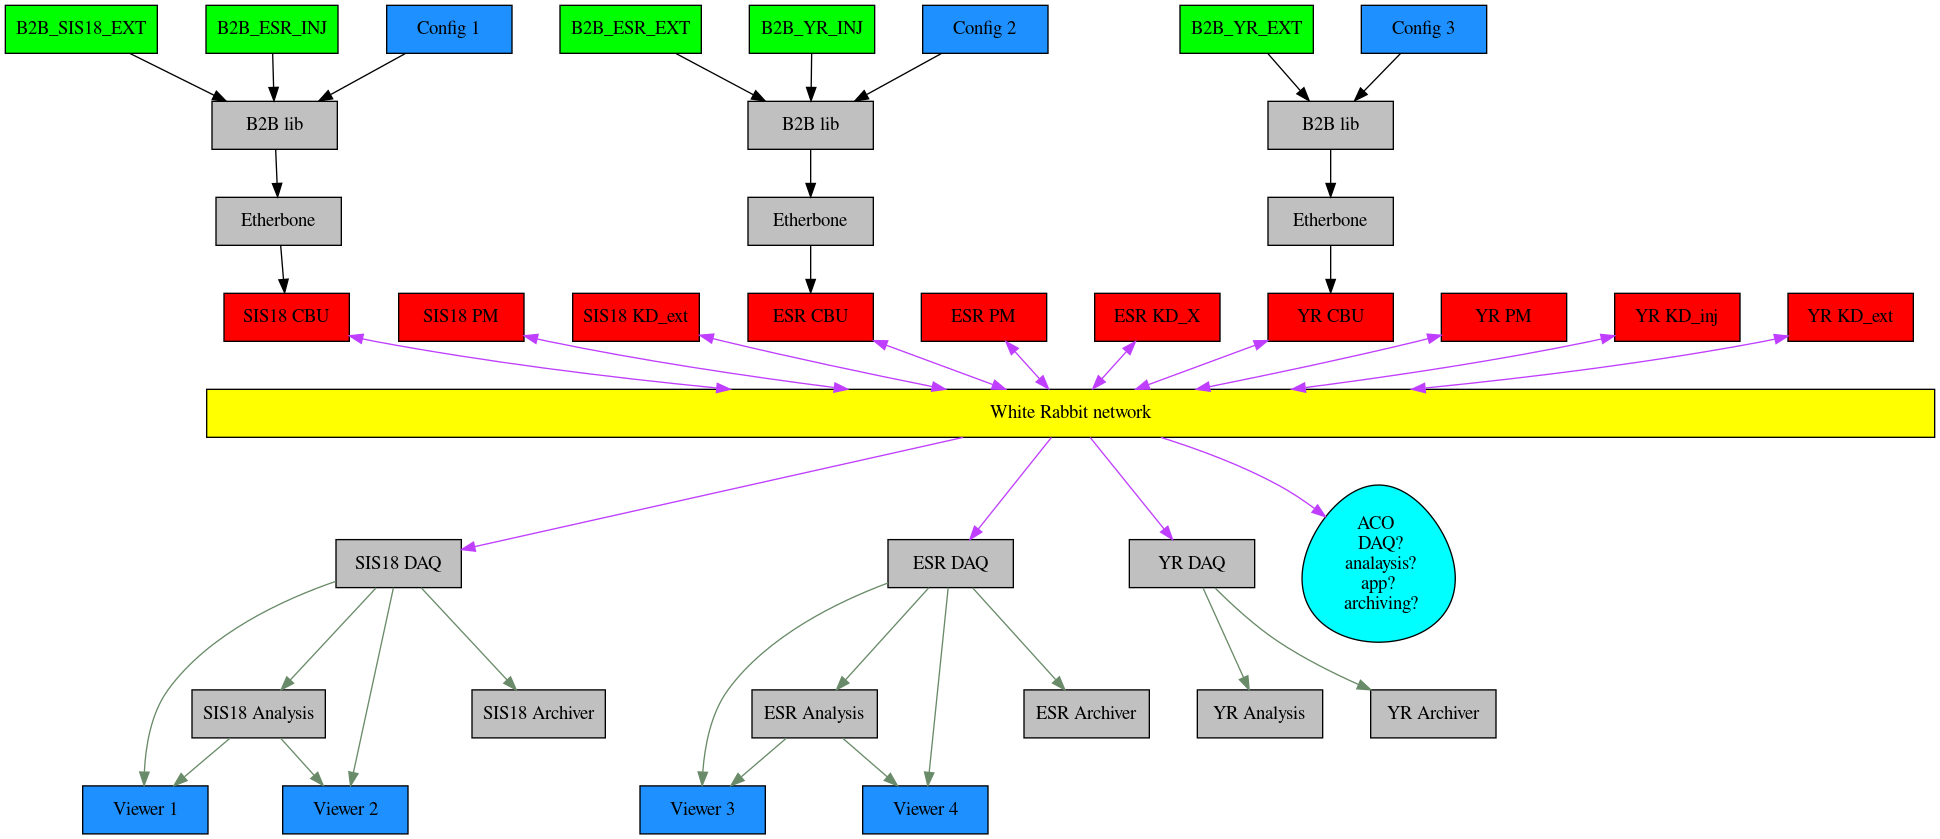 Figure: Topology of the B2B system for three ring machines: Control (top), realtime layer (middle) and monitoring (bottom). Boxes and eggs denote components such as expert user interfaces (blue), instances of FESA classes (green), other x86 software (grey), firmware (red), the White Rabbit network (yellow) and a future-moon-landing-mission-solution spanning all layers of ACO (cyan, probably not required). Interconnections between components are indicated as arrows such as timing messages (magenta) and server client relationship implemented via DIM (darkseagreen). There may be none, one or multiple user interfaces for configuration or viewing. Details see text.
Control and Fieldbus Layer
The figure above shows the system topology for control and monitoring. The simplest part is control implemented in the x86 host system(s). One ore more command-line user interfaces (CLI) write set-values to the CBU firmware. The communication layer is Etherbone. However, the Etherbone layer is encapsulated in a shared 'B2B-library'. Writing set-values just requires calling a routine implemented in the library. Today (March 2021) the CLI is operated on the ASL cluster and uses Etherbone via the ACC network as 'middleware'; the only 'frontend software' for control is a socat process. For 2022 the control layer will be extended by FEA classes. Each CBU will have two FESA classes (if applicable). One that receives the set-values for the extraction ring from LSA. Another one receives the set-values for the injeciton ring. The fieldbus layer consists of lm32 interconnected via the White Rabbit network. The realtime communication is described elsewhere.On-Line Diagnostic
Monitoring turned out to be much more challenging. Especially the ability to diagnose potential issues and their history is of prime importance: Even more important than the get-values of the current transfer are statistical information such as average (mean) value, standard deviation and minimum and maximum value. It is important to provide these data for a longer time span, then just the time for which an application has been opened. Thus, statistical data must be provided in a separate analysis and data layer. Moreover, it must be possible to view the status of the B2B system from anywhere on the network. The implemented solution consists of a simple client-server architecture that follows the 'principle of separation of functions'. Each client or server is extremely simple and just a few hundreds lines of code.- DAQ. A process that collects all timing messages relevant for B2B transfer. It uses saftlib as an interface to the timing system. It does not do any kind of data processing. This process implements a server the publishes set-values and get-values as services.
- Archiver. This process is a client and subscribes to set-values and get-values published by DAQ server. There is no processing of the data. The raw data are just written to a file. At present (March 2021) the file format is just a text file for two reasons. First, data types of set- and get-values might change and it must be possible to read 'old' data files even after data formats have changed. Second, text files allow easy import and further analysis in spread-sheet calculation programs.
- Analysis. A process that is a client and server at the same time.
- The client part subscribes to set-values and get-values published by the DAQ server. The data are analyzed and processed.
- The server part publishes the results of the analysis as services.
- Viewer. This is a client that subscribes to data published by DAQ and Analysis. It does not do any data processing but just displays the data.
- extremely limited man-power during the development: a light-weight simple tool was needed
- well tested and widely used at CERN since the 1990s
- open source
- no infrastructure required
- well suited for home-office development during the Covid pandemic
- it is easy to setup small standalone test or development systems
Off-Line Diagnostic
Data written by the archiver are accessible for off-line analysis. Although all data are written to file, the size of the data files is just a few Megabytes per day. So far, there are no dedicated off-line tools: Readily available tools are spreadsheet calculation and plotting tools such as gnuplot.Control System Integration
The control user interface part can most likely be achieved by minor modifications of the ParamModi program. A FESA class as frontend software is required on each Frontend Computer hosting a CBU. The shared 'B2B library' can serve as an interface between the FESA class and the lm32 CBU firmware. The diagnostic part is probably easy too, as only a minor fraction of the diagnostic parameters are of interest for the operators in the main control room.Supervision
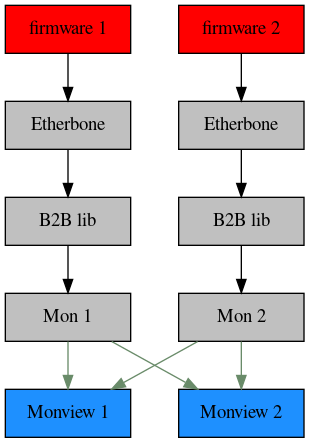 Figure: Extremely simple supervision. Boxes denote components such as user interfaces (blue), other x86 software (grey) and firmware (red)/ Interconnections between components are indicated as arrows. Server-client relationship implemented via DIM are indicated with darkseagreen arrows. There may be none, one or multiple user interfaces viewing.
-- DietrichBeck - 24 June 2021
Figure: Extremely simple supervision. Boxes denote components such as user interfaces (blue), other x86 software (grey) and firmware (red)/ Interconnections between components are indicated as arrows. Server-client relationship implemented via DIM are indicated with darkseagreen arrows. There may be none, one or multiple user interfaces viewing.
-- DietrichBeck - 24 June 2021 Edit | Attach | Print version | History: r9 < r8 < r7 < r6 | Backlinks | View wiki text | Edit wiki text | More topic actions
Topic revision: r9 - 14 Jul 2021, DietrichBeck
- Toolbox
-
 Create New Topic
-
 Index
Index
-
 Search
-
 Changes
-
 Notifications
-
 RSS Feed
-
 Statistics
-
 Preferences
Ideas, requests, problems regarding Foswiki? Send feedback