You are here: Foswiki>Applications Web>AppOnCallDutyMain>AppOnCallDutyInfoStoRiMo (10 Nov 2023, BenjaminPeter)Edit Attach
Storage Ring Mode App Info: On-call duty / Rufbereitschaft
- General Info
- Troubleshoot
- Where do I find logs about the app?
- Why are there no patterns shown?
- Why is a specific pattern not shown?
- Where does the signal state come from?
- Signal state switching is not working!
- Sub chain repetition count is not available or can't be set
- The currently running sub chain is not highlighted!
- The sub chain is marked for a long time in grey!
- Enable debug log
General Info
AppApplicationStorageRingModeApplicationTroubleshoot
Where do I find logs about the app?
Warnings and worse: program.keyword:expert-storageringmode-app AND levelWhy are there no patterns shown?
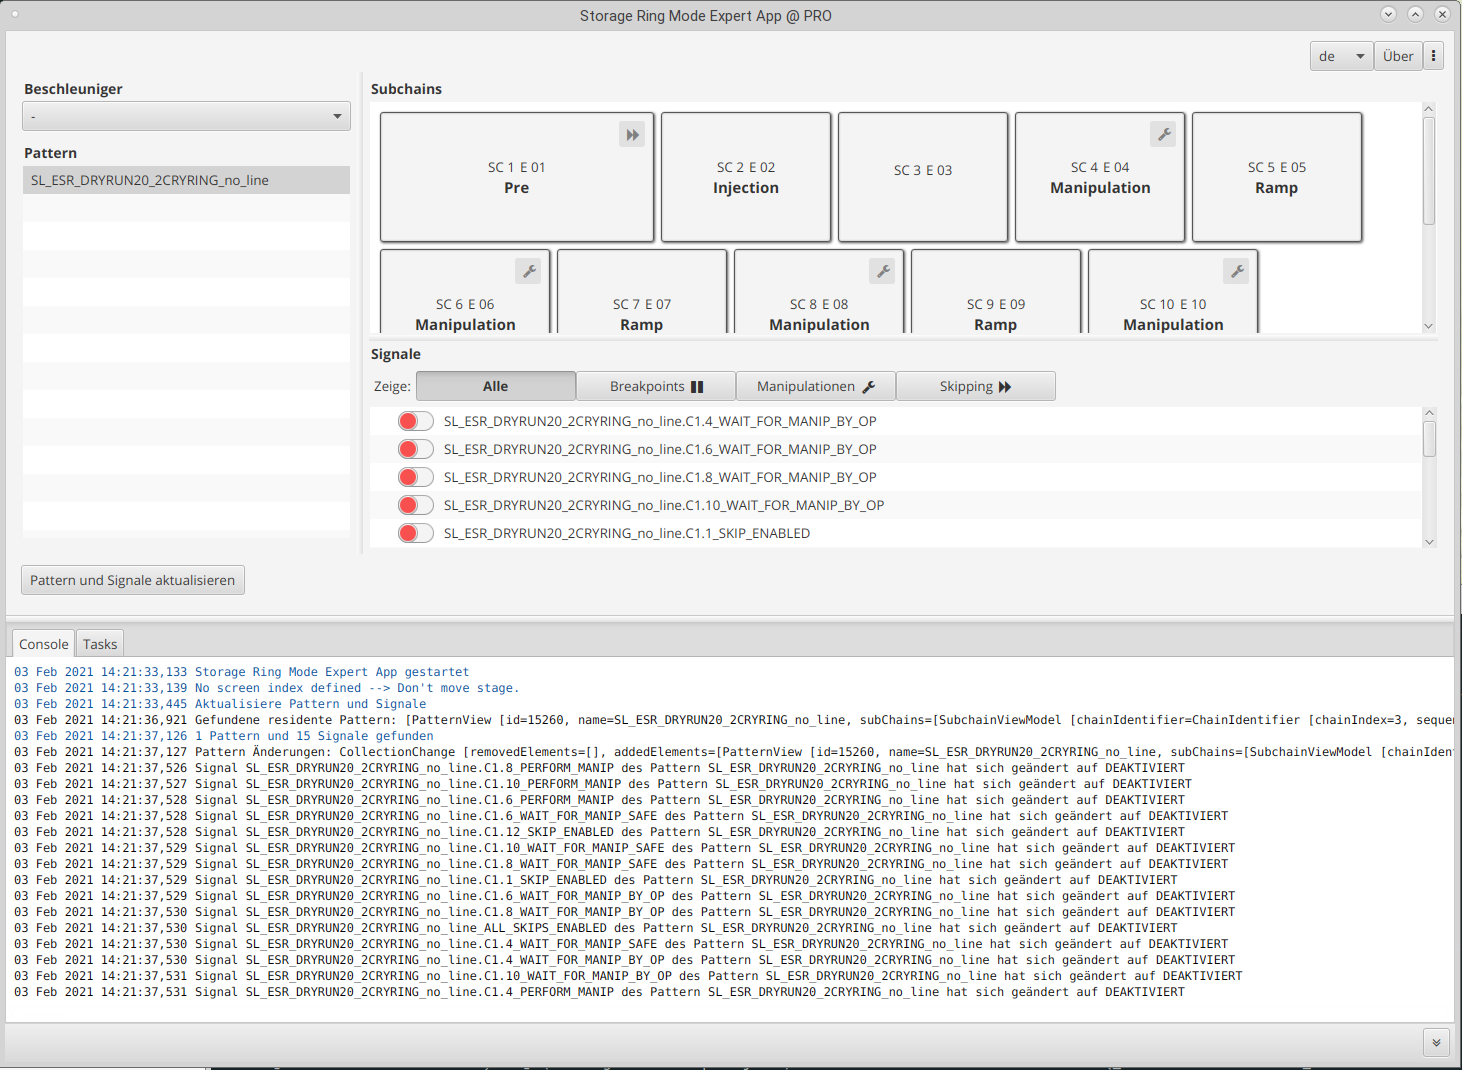
Please check the app log console for errors about the communication with the LSA server. Check if the LSA server is running. If it is, try an app restart (the app does not hold relevant user input that needs to be saved). You can enable debug output to see the details of a pattern and chain update: See AppOnCallDutyInfoStoRiMo#Enable_debug_log on how to do that. If you enabled the debug output: search the console log for the following messages indicating a pattern list and sub chain change as well as their state:03 Feb 2021 09:41:15,763 Aktualisiere Pattern und Signale 03 Feb 2021 09:41:22,957 Gefundene residente Pattern: [PatternView [id=15008, name=CRYRING_D_local, subChains=[SubchainViewModel [chainIdentifier=ChainIdentifier [chainIndex=2, sequenceId=1], name=CRYRING_D_local.C1.1, displayName=1, lengthMicros=627000, repeatable=false, skippable=false, containsBreakpoints=false, manipulation=false, sequenceNameOptional=Optional.empty, purposeNameOptional=Optional[Injection]], SubchainViewModel [chainIdentifier=ChainIdentifier [chainIndex=2, sequenceId=2], name=CRYRING_D_local.C1.2, displayName=2, lengthMicros=350000, repeatable=false, skippable=false, containsBreakpoints=false, manipulation=true, sequenceNameOptional=Optional.empty, purposeNameOptional=Optional[Manipulation]], …] 03 Feb 2021 09:41:26,548 2 Pattern und 18 Signale gefunden 03 Feb 2021 09:41:26,561 Pattern Änderungen: CollectionChange [removedElements=[], addedElements=[PatternView [id=15008, name=CRYRING_D_local, subChains=[SubchainViewModel [chainIdentifier=ChainIdentifier [chainIndex=2, sequenceId=1], name=CRYRING_D_local.C1.1, displayName=1, lengthMicros=627000, repeatable=false, skippable=false, containsBreakpoints=false, manipulation=false, sequenceNameOptional=Optional.empty, purposeNameOptional=Optional[Injection]], …]
 Code: git: Task update patterns and chains
Why is a specific pattern not shown?
Only patterns that are relevant for storage ring mode operations are shown. Only patterns that are resident and part of a pattern group are shown. Maybe compare to the display in BSS Control App. At the moment this means they have to contain Break-Points or Manipulations or Repeatable-Subchains or Skippable-Subchains. Code: git: Filtering of pattern - see also the following StorageRingModeUtilsWhere does the signal state come from?
The list of signals for a pattern is fetched via LSA (git: StoRiMo service call is done here) but the state is fetched using the BSS Service AKA RequestProcessor http://asl157.acc.gsi.de:5210/rp/ configured in https://git.acc.gsi.de/fcc-applications/common-config/src/branch/pro/default.properties asrequester.base_url Group: Services / skrepp). From now on just noted as BSS-SERVER.
Search in app console for output like this, indicating initial state information and update from requester service:
03 Feb 2021 09:41:26,959 Signal CRYRING_D_local.C1.2_WAIT_FOR_MANIP_SAFE des Pattern CRYRING_D_local hat sich geändert auf DEAKTIVIERT
03 Feb 2021 09:41:26,961 Signal CRYRING_D_local.C1.2_WAIT_FOR_MANIP_BY_OP des Pattern CRYRING_D_local hat sich geändert auf DEAKTIVIERT
03 Feb 2021 09:41:26,962 Signal CRYRING_D_local.C1.2_PERFORM_MANIP des Pattern CRYRING_D_local hat sich geändert auf DEAKTIVIERT
Signal state is fetched with the help of the lib git: bss-client-lib / RequestProcessorFacade. For debugging all available signals known to BSS can be fetched manually for debugging using
http / curl:
curl -X GET -H "Content-Type: application/json" BSS-SERVER/signals

…
  {
    "id": 10029,                                            <--- Relevant id for state get or changes!
    "name": "SL_ESR_DRYRUN20_2CRYRING_no_line.C1.1_SKIP_ENABLED",
    "type": {
      "name": "SKIP_ENABLED",
      "id": 11,
      "userChangeable": true,                               <--- Can be changed!
      "dynamic": true
    }
  },
  {
    "id": 10030,
    "name": "SL_ESR_DRYRUN20_2CRYRING_no_line.C1.4_WAIT_FOR_MANIP_BY_OP",
    "type": {
      "name": "WAIT_FOR_MANIP_BY_OP",
      "id": 8,
      "userChangeable": true,
      "dynamic": true
    }
  },
  {
    "id": 10031,
    "name": "SL_ESR_DRYRUN20_2CRYRING_no_line.C1.4_WAIT_FOR_MANIP_SAFE",
    "type": {
      "name": "WAIT_FOR_MANIP_SAFE",
      "id": 9,
      "userChangeable": false,
      "dynamic": true
    }
  },
…
The state of the signals can be fetched like this:
# prepare a request_state.json file containing the signal id
cat request_state.json
{
  "dynamicSignalIds" : [ 10025 ]
}

# Call the service using that file as body
curl -X PUT -d@request_state.json -H "Content-Type: application/json" "BSS-SERVER/getSignalStates"

{"dynamicSignalStates":{"10025":false},"staticSignalStates":{}}
(Why is this web service call so complicated? … I don't know …)
Signal state switching is not working!
Signals are also switched usingbss-client-lib and the BSS web service underneath. After switching the state in the UI the state is refreshed and will show the current state as reported by BSS, this means if the switch did not succeed you should look out for errors in the BSS web service.
This Logging query might help: program.keyword:bss-server AND (message:signal OR message:repetition)
Signal switching could be done manually in tough cases by issuing a PUT call to BSS-SERVER/updateSignalStatesAndCancelRepetitions
# Create a file with the desired state and signal name):
# Signal id can be retrieved from the all signal query above.
cat request.json

{
  "dynamicSignals" : [ {
    "enabled" : false,
    "id" : 9128
  } ],
"staticSignals" : []
}


# Call the service with the given file / payload
curl -v -X PUT -d@request.json "BSS-SERVER/updateSignalStatesAndCancelRepetitions" -H  "Accept: application/json" -H "Content-Type: application/json"
Sub chain repetition count is not available or can't be set
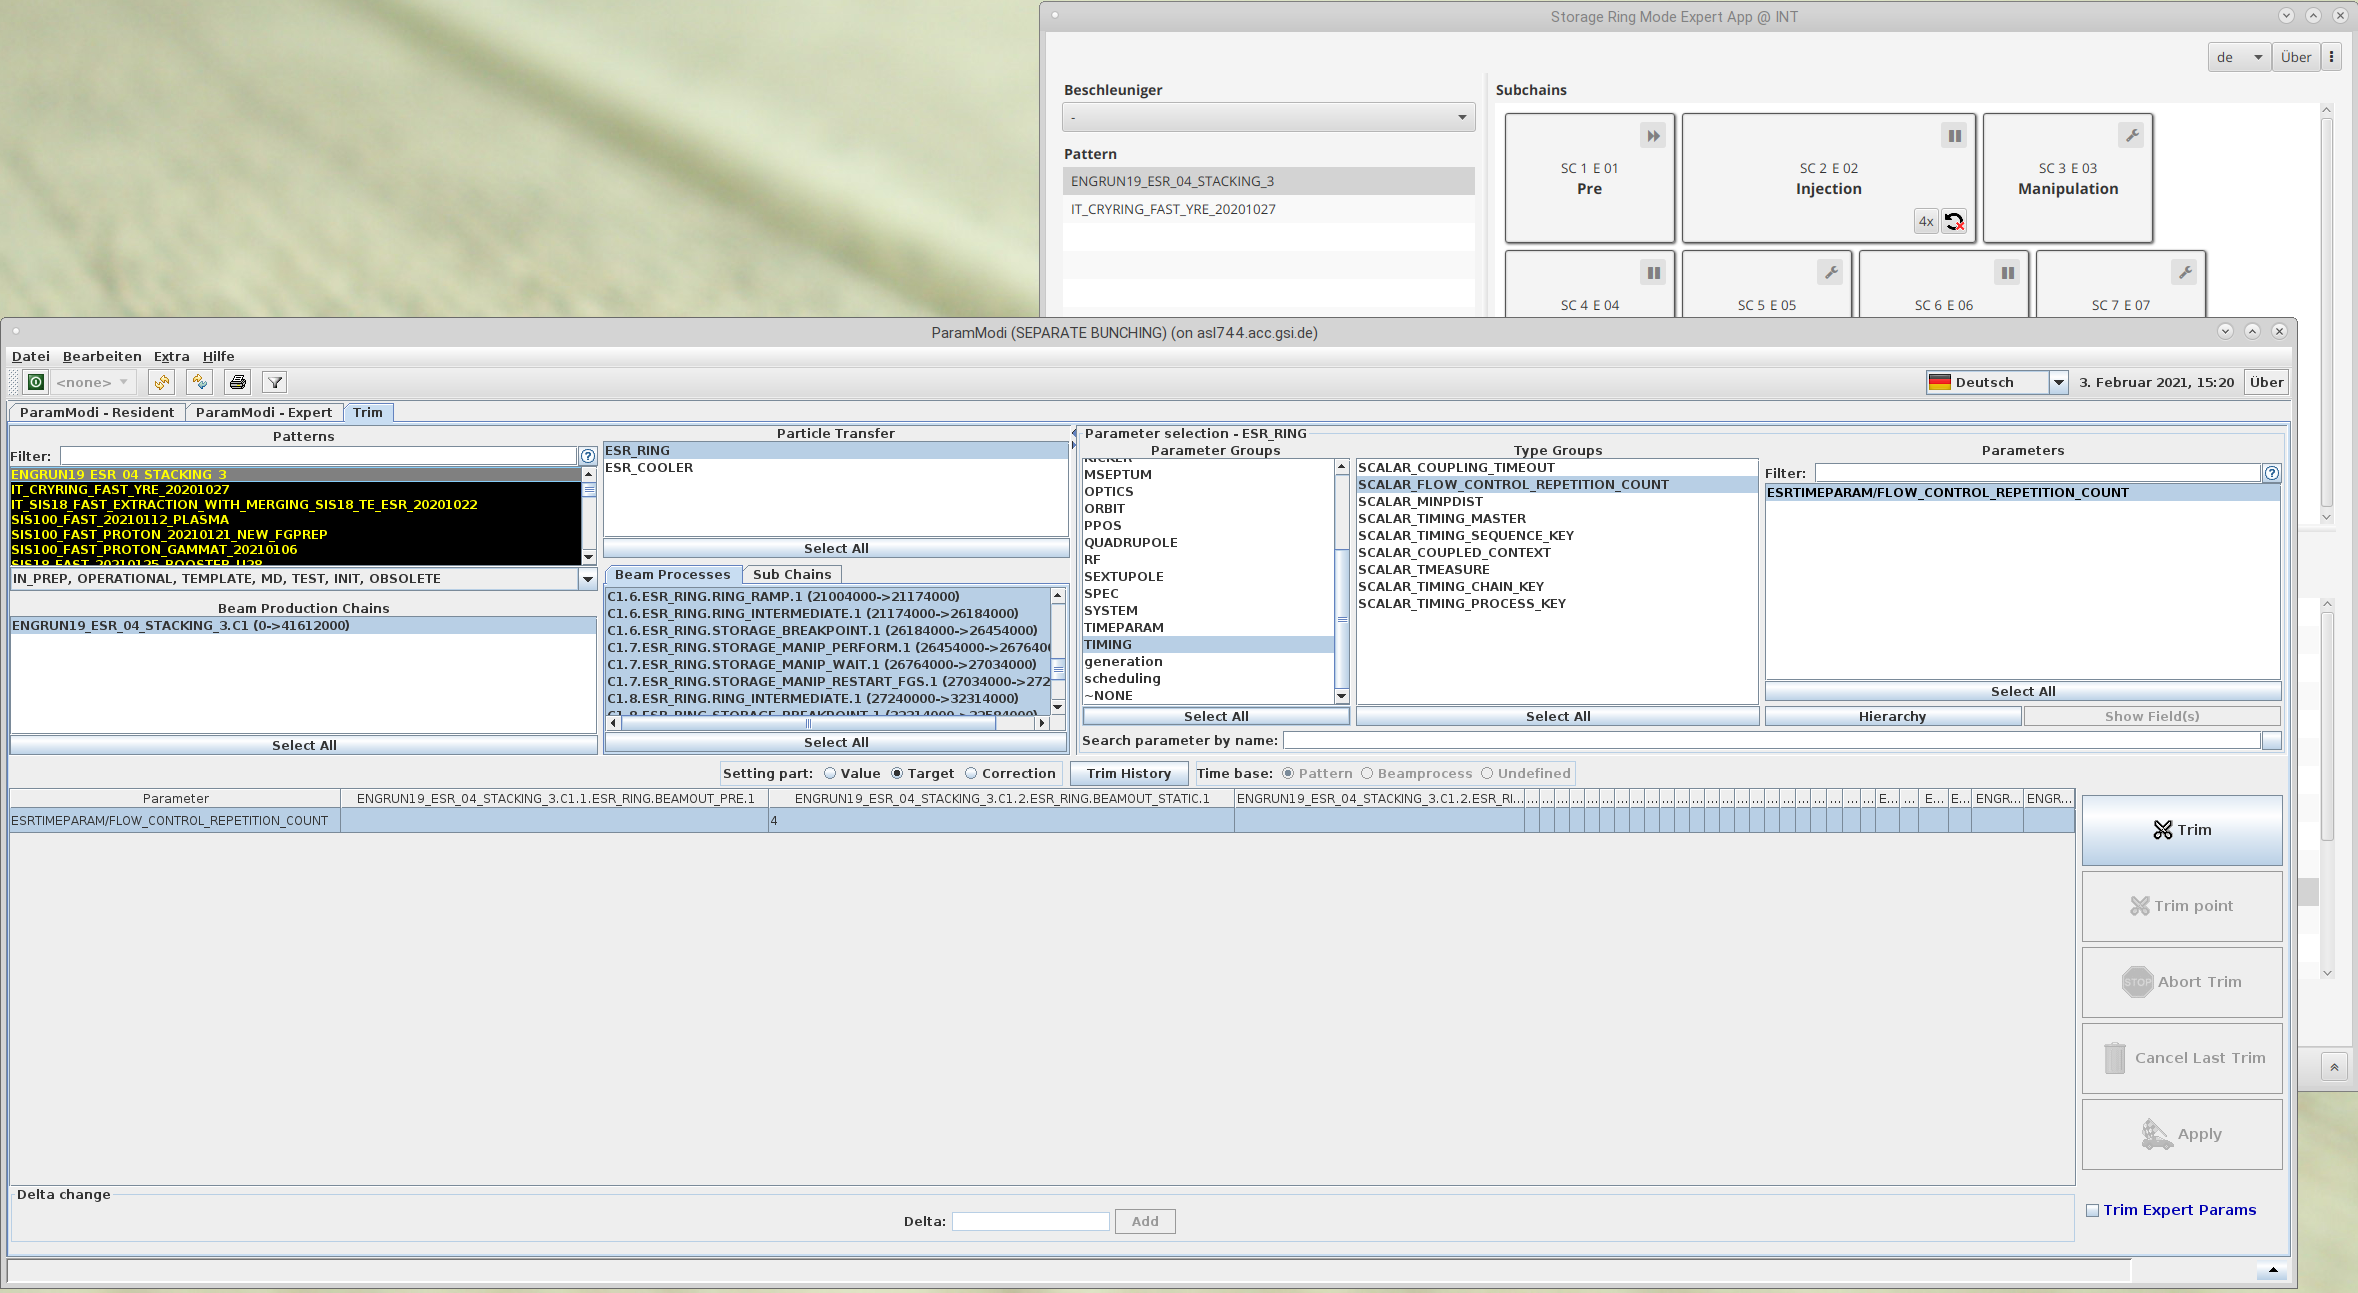
Sub chain count is fetched using LSA. Please look for errors regarding the communication to LSA. If the sub chain repetition count is still loading or not available because of an error it is initially display as a question mark. Check for running applications tasks in the app console and log output. You can see the repetition count parameter of a chain manually using ParamModi. The setting is stored in the LSA model, in the first stand alone beam process that has a parameter typeSCALAR_FLOW_CONTROL_REPETITION_COUNT
In the following example of an ESR sub chain the parameter is: ESRTIMEPARAM/SCALAR_FLOW_CONTROL_REPETITION_COUNT ENGRUN19_ESR_05_STACKING3.C1.2.ESR_RING_BEAMOUT_STATIC.1 (Parameter Group TIMING Type Group SCALAR_FLOW_CONTROL_REPETITION_COUNT)
 Setting the repetition count is performed using an LSA trim. Please see the LSA logs in case of a problem with this feature.
The app locks the input for all other repetition count controls of that pattern while the trim is running. If this state is not recovering make sure the trim is not blocked because of an active break point or similar that will prevent the timing from pausing. The UI's locked state should end when the trim task (See app console, running Application Tasks) is finished. In case of a singular problem with this behaviour, an app restart should help.
Code git: SubChainRepetitionCountUpdater.java
The currently running sub chain is not highlighted!
This display is purely "informational" and has no influence on the availability of any function in the UI, an experienced user might be able to get similar information by looking at the event monitor or what's running. The running sub chain information is gathered using bss-client-lib and the snoop SCU (at the momentZT00ZM02 see pro config bss.client.snoopDeviceName for current value). Events and pattern information is correlated in order to highlight the matching sub chain. So both the snoop SCU and LSA must be available, a problem here should affect What's Running as well. (Attention: bss-client-lib uses the REST API and RMI only as fallback).
You can inspect ZT00ZM02 / WRSnoop_DU.fecl003 using FESA Explorer for any problems. ZT00ZM01 might be available as an alternative source for the data but test it first…
The sub chain is marked for a long time in grey!
The grey marker on the sub chain just means that this sub chain was most recently running and should be finished according to the timing plan and we have not yet received an event for another sub chain of that pattern. It is supposed to help the operator to remember what the previously running sub chain was even if there is no activity. A sub chain might still be considered as running, because it is dynamically stretched and waiting on another machine, for example during an injection. The grey marker will also stay at the last sub chain of a pattern while other patterns are served until the currently viewed pattern is active again. This should not be worrying and is just due to the fact the we do not know for sure when the sub chain has ended. The marker might also be "stale" if the timing was stopped / the pattern disabled. Example:
Enable debug log
Restart with different logger
You can either restart the app from the terminal with a different logger configuration:webstart https://websvcpro.acc.gsi.de/groups/fcc/applications/expert-storageringmode-app.zip --config=pro --vmargs="-Dlog4j.configurationFile=log4j2-dev.xml
log4j2-dev.xml is usually available in our classpath.
Change logger level during runtime
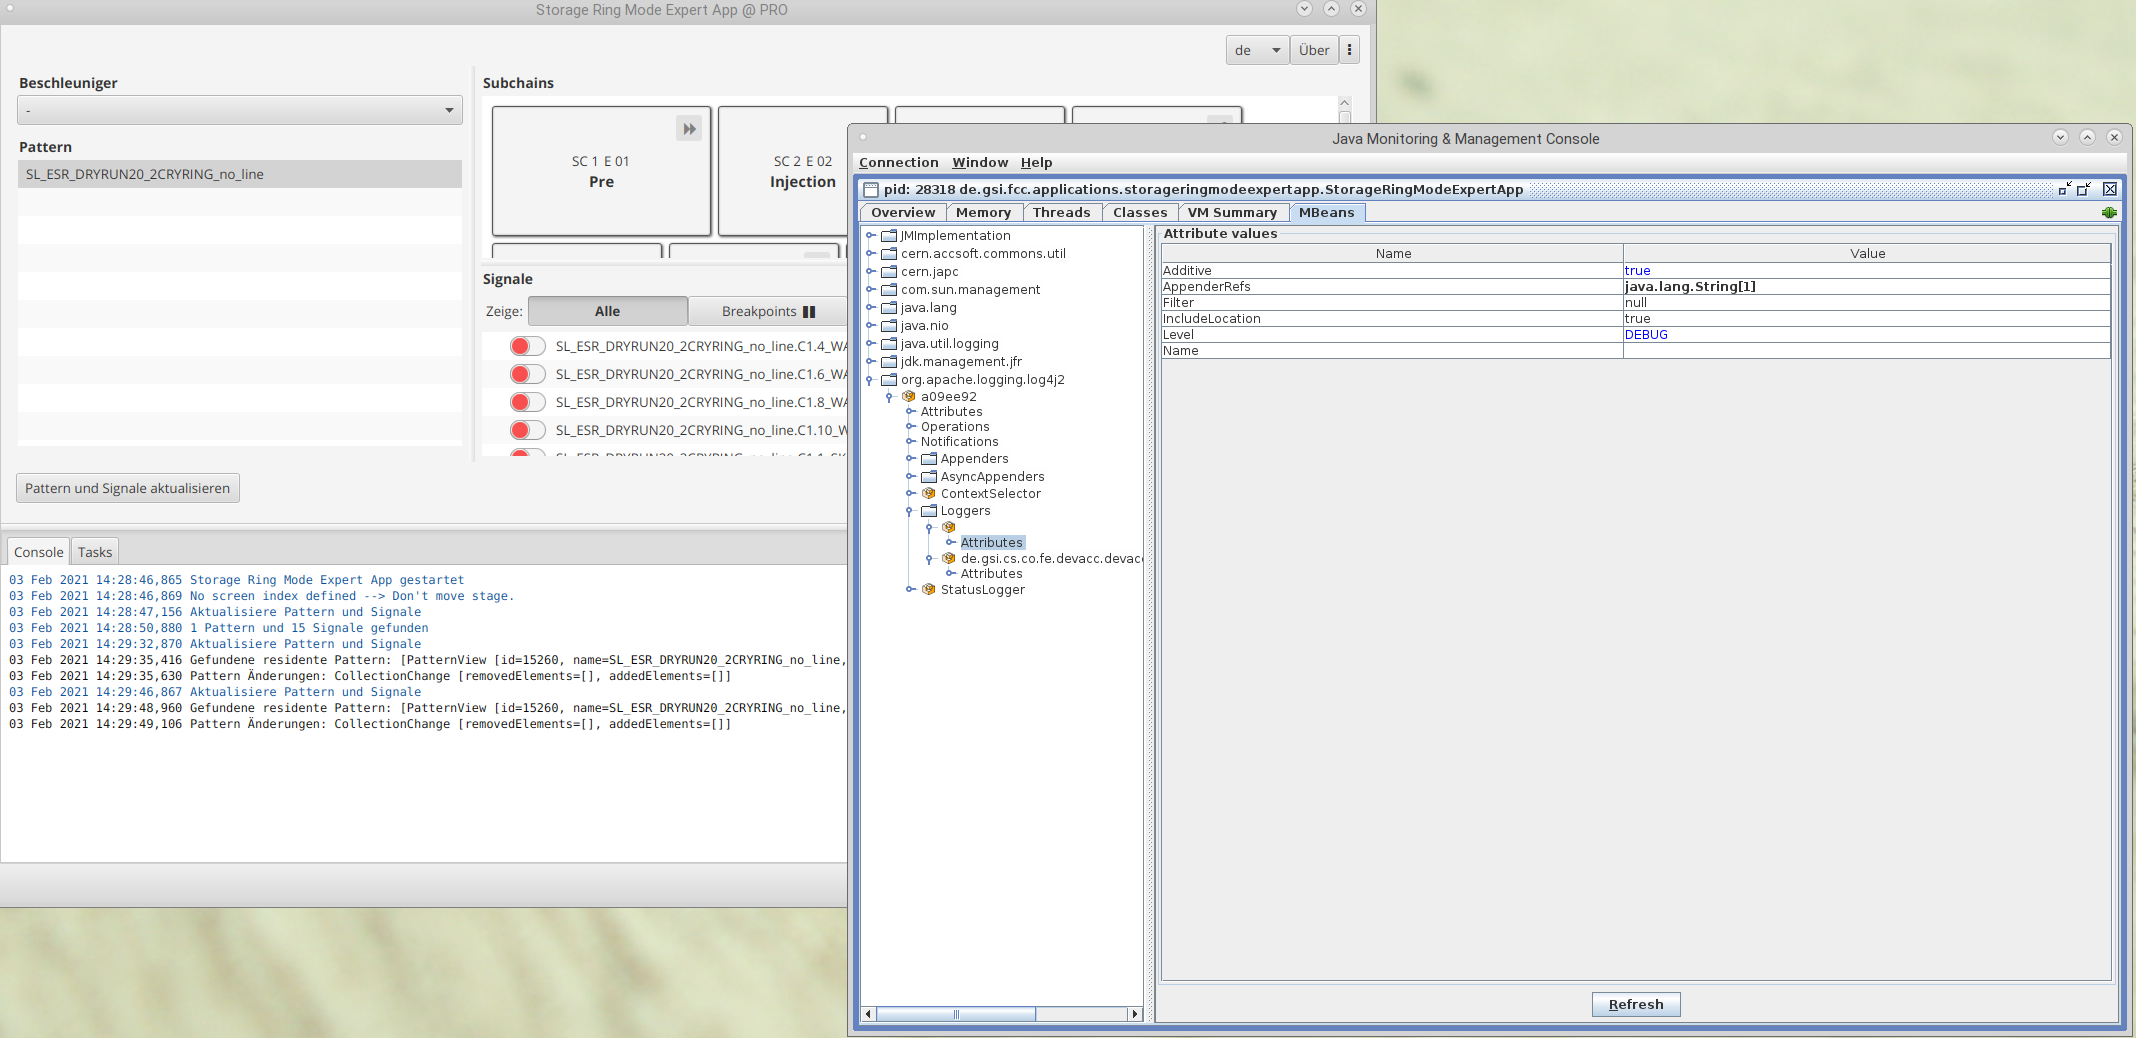
Or usejconsole to modify the log level during runtime.
Locate the MBean org.apache.logging.log4j2.SOME_HEX_STRING.Loggers.ENTRY_WITHOUT_NAME.Attributes.Level and edit it from INFO to DEBUG. Make sure to set it back afterwards. (Do not use bold names literally)

| I | Attachment | Action | Size | Date | Who | Comment |
|---|---|---|---|---|---|---|
| |
Screenshot at 2021-02-03 14-22-12.png | manage | 241 K | 03 Feb 2021 - 13:42 | BenjaminPeter | |
| |
Screenshot at 2021-02-03 14-29-52.png | manage | 295 K | 03 Feb 2021 - 13:34 | BenjaminPeter | |
| |
Screenshot at 2021-02-03 15-20-03.png | manage | 405 K | 03 Feb 2021 - 14:29 | BenjaminPeter | |
| |
vlcsnap-2021-02-04-19h05m05s050.png | manage | 328 K | 04 Feb 2021 - 18:06 | BenjaminPeter |
Edit | Attach | Print version | History: r9 < r8 < r7 < r6 | Backlinks | View wiki text | Edit wiki text | More topic actions
Topic revision: r9 - 10 Nov 2023, BenjaminPeter
 Copyright © by the contributing authors. All material on this collaboration platform is the property of the contributing authors.
 Ideas, requests, problems regarding Foswiki? Send feedback


