You are here: Foswiki>Applications Web>AppOnCallDutyMain>AppOnCallDutyInfoDigitizerApp (10 Nov 2023, BenjaminPeter)Edit Attach
Digitizer App Info: On-call duty / Rufbereitschaft
- General Info
- Troubleshoot
-
- Where do I find logs about the app?
- A device is missing from the list
- A channel of a device is missing from the list
- The channels are not grouped properly but shown in generic groups like 'other'
- Chain and beam process cannot be selected for a triggered channel
- An event is missing from the trigger event list
- There is an error when opening the channel / subscription
- The channel data is showing the wrong signals / measuring a different source
- The shown data has the wrong amplitude / value
- There is no data shown in the chart
- The shown data has a lot of missing parts
- Full Sequence mode does not show the full pattern
- The context can only be selected for triggered signals
- Known Bugs
- Other problems regarding digitizer / DAQ devices
- Inside the chart UI element something weird happens
- I need a list of the sent data in order to debug it
-
General Info
The main list displays channels, not devices organized by channel names! A channel might come from a picoscope digitizer and from the device itself! AppApplicationDigitizer- expert-digitizer-app README on gitea
- DAQ FESA API https://git.acc.gsi.de/schwinn/daq_api and daq_api.xml
- Main source for the list of available digitizer devices and their channel’s measured devices is the Digitizer Master Plan (gitlab / aschwinn)
Troubleshoot
Where do I find logs about the app?
Logging.- Warnings and worse: program.keyword:expert-digitizer-app AND level
- Ignoring "Data sanity check failed" messages: program.keyword:expert-digitizer-app AND level
A device is missing from the list
First try searching for it by name in the list tab. It should match channel name, measuring device name or SCU name. If a device is not reachable during start or does not provide a DAQ config (property) it will not be shown. See the logs for errors regarding the measuring device (possible the picoscope nomenclature, see config or master plan if you don't know it) in this case.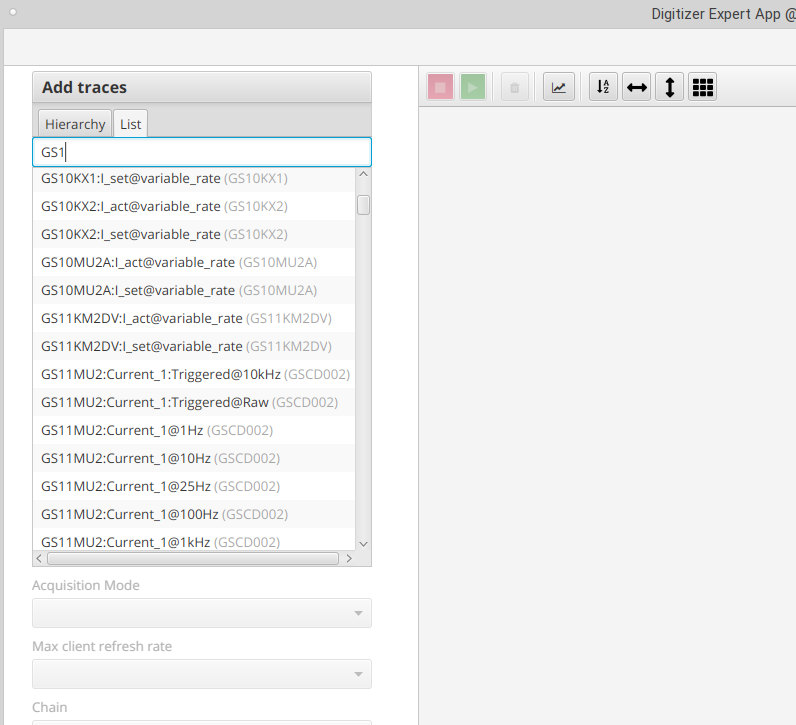 Upon start the app looks for available devices so sometimes a simple restart of the app can help here.
The list of theoretically available devices is configured in
 common-config: https://git.acc.gsi.de/fcc-applications/common-config/src/branch/pro/digitizer-expert-app-device-list.csv (app restart after change)
Some devices are not known to LSA or under a different name the following mapping file helps grouping the channels but this should not be too relevant for on call duty calls: https://git.acc.gsi.de/fcc-applications/common-config/src/branch/pro/digitizer-expert-app-device-map.csv
List of found / active devices: DigitizerList output
During start, the app logs device statistics, search for the following in the logging system. More details are loged when debug is enabled.program.keyword:expert-digitizer-app AND logger.keyword:*DigitizerList AND message:DAQ
DAQ device count: Nameserver error: 0 Offline: 55 Invalid version (online): 0 Config error: 4 DAQ disabled: 500 Online: 47

Debug:

digitizer.DigitizerList.gDigitizerStatusOverview  DAQ devices invalid version (online): -
digitizer.DigitizerList.gDigitizerStatusOverview  DAQ devices config error ...........:
[bpeter: wrapped for better readability]
    GE01KP05@scuxl0181
    GE01KX1@scuxl0206
[…]
    GS09KS3C@scuxl0041
    GS11KS1C@scuxl0069
    GS11KS3C@scuxl0041
digitizer.DigitizerList.gDigitizerStatusOverview  DAQ devices nameserver error .......: -
digitizer.DigitizerList.gDigitizerStatusOverview  DAQ devices offline ................: GSCD022@fel0054, GS10MU1A@scuxl0305
digitizer.DigitizerList.gDigitizerStatusOverview  DAQ devices online .................:
    GSCD023@fel0053
    GSCD025@dal025
    GSCD024@fel0021
[…]
    GSCEMO5K@scuxl0225
    GSCEMT4K@scuxl0225
Exception from device USER_ERROR: Error caused by: DAQ is disabled for this device
Exception in thread "main" cern.japc.core.ParameterException: USER_ERROR: Error caused by: DAQ is disabled for this device (see field daqEnabled).. src/PowerSupply/Server/DAQChannelConfigGetAction.cpp:63This exception as response to a DAQ property (like
ChannelConfigDAQ) is thrown by the frontend (usually the PowerSupplies) when DAQ is disabled. Frontend will have to enable it.
Exception from device USER_ERROR: Error caused by: FESA No SignalSource (FgFeedbackChannel) available for device
Exception in thread "main" cern.japc.core.ParameterException: USER_ERROR: Error caused by: FESA No SignalSource (FgFeedbackChannel) available for device '1S00QD1F'. src/PowerSupply/RealTime/RTDeviceClass.cpp:889This exception as response to a DAQ property (like
ChannelConfigDAQ) is thrown by the frontend (usually the PowerSupplies) when DAQ is not fully set up and frontend will have to repair it.
Version errors
The app checks the measuring device's parameterVersion#daqAPIVersion, if it is present it must conform to a certain value since there might be multiple incompatible versions deployed. If the value is not found or empty it is okay too (was not set correctly for some devices in the past, might be made more strict in the future, see git: DigitizerVersionFilter (permalink)).
/common/usr/cscofe/bin/pdex GSCD002 Version daqAPIVersion
NOMEN  = GSCD002 (DigitizerDU2.dal007 | DigitizerClass2)
TIMDOM = SIS18_RING (300)
|
Version CTXT = 11:45:52.184678 (04.02.21)
|-- daqAPIVersion        = 1.0
A channel of a device is missing from the list
If a measuring device (DAQ device) is configured and available the list of it's channels (and devices it is measuring (measured device)) is retrieved from the device itself. There is for example the digitizer device GSCD002 measuring current fromGS11MU2 but there is also GS11MU2 measuring itself.
It is available via parameter ChannelConfigDAQ#channelNames
/common/usr/cscofe/bin/pdex GS11MU2 ChannelConfigDAQ channelNames
NOMEN  = GS11MU2 (PowerSupplySis18_DU.scuxl0190 | RampedHvPS)
TIMDOM = SIS18_RING (300)
|
ChannelConfigDAQ
|-- channelNames     =      | GS11MU2:Current_1:Triggered@10kHz                | GS11MU2:Current_1:Triggered@Raw                  | GS11MU2:Current_1@100Hz      | GS11MU2:Current_1@10Hz                           | GS11MU2:Current_1@10kHz
[…]
(In case of errors with dex, double check with fex as they seem to use different FESA info sources)
Checking the configuration of a DAQ device using fex

Checking the configuration of a DAQ device using dex (alternative)
Fetch the propertyChannelConfigDAQ
/common/usr/cscofe/bin/pdex GSCD002 ChannelConfigDAQ

NOMEN  = GSCD002 (DigitizerDU2.dal007 | DigitizerClass2)
TIMDOM = SIS18_RING (300)
|
ChannelConfigDAQ CTXT = 18:31:32.156700 (03.02.21)
|-- status_severity  =
    | 2
    | 2
[…]

|-- triggerEvents    =      | CMD_SEQ_START             | CMD_BEAM_INJECTION        | CMD_BEAM_EXTRACTION       | CMD_START_ENERGY_RAMP     | CMD_CUSTOM_DIAG_1 | CMD_CUSTOM_DIAG_2         | CMD_FG_START              | EVT_COMMAND
[…]

|-- channelNames     =      | GS11MU2:Current_1:Triggered@10kHz                | GS11MU2:Current_1:Triggered@Raw                  | GS11MU2:Current_1@100Hz      | GS11MU2:Current_1@10Hz                           | GS11MU2:Current_1@10kHz
[…]

|-- status_labels    =      | OVERVOLTAGE              | REALIGNMENT_FAILED       | SAMPLES_LOST             | MAX_OVERFLOW_ERROR       | MAX_OVERFLOW_WARNING     |    MAX_OVERFLOW_INFO        | MIN_OVERFLOW_ERROR       | MIN_OVERFLOW_WARNING     | MIN_OVERFLOW_INFO
[…]

|-- channelDataRates =      | 0=10000.0000       | 0=2000000.0000     | 0=100.0000         | 0=10.0000          | 0=10000.0000       | 0=1.0000           | 0=1000.0000        | 0=25.0000          | 0=10000.0000       | 0=2000000.0000     | 0=100.0000
[…] (anm. source data rate!)

|-- channelUnits     =      | V     | V     | V     | V     | V     | V     | V     | V     | A     | A     | A     | A     | A     | A     | A     | A     | A     |  A     | A     | A     | A     | A     | A
[…]
Checking the configuration of a DAQ device using daq-data-dumper (alternative)
daq-dumper can be used onasl7 to print configuration information about the device (and dump acquisition data).
~bpeter/public/daq-dumper/daq-dumper-pro.sh --config --device GSCD002
[…]
INFO [03 Feb 2021 18:19:54,022] (ClientConnection.java) - connection tcp://dal007:4283: connected to 'tcp://dal007:4283/0'
 INFO [03 Feb 2021 18:19:54,075] (DaqDumper.java) - GSCD002: DigitizerVersion [classVersion=4.2.0, daqAPIVersion=1.0]
 INFO [03 Feb 2021 18:19:54,086] (DaqDumper.java) - GSCD002: status_severity (int[]:13) ->
    2,
    2,
    2,
[…]
channelDataRates (float[]:72) ->
    10000.0,
    2000000.0,
    100.0,
[…]
status_labels (String[]:13) ->
    OVERVOLTAGE,
    REALIGNMENT_FAILED,
    SAMPLES_LOST,
[…]
channelUnits (String[]:72) ->
    V,
    V,
    V,
[…]
channelNames (String[]:72) ->
    GS11MU2:Current_1:Triggered@10kHz,
    GS11MU2:Current_1:Triggered@Raw,
    GS11MU2:Current_1@100Hz,
[…]
    GS11MU2:Voltage_1:Triggered@10kHz,
    GS11MU2:Voltage_1:Triggered@Raw,
    GS11MU2:Voltage_1@100Hz,
[…]
triggerEvents (String[]:8) ->
    CMD_SEQ_START,
    CMD_BEAM_INJECTION,
    CMD_BEAM_EXTRACTION,
    CMD_START_ENERGY_RAMP,
    CMD_CUSTOM_DIAG_1,
    CMD_CUSTOM_DIAG_2,
    CMD_FG_START,
    EVT_COMMAND
The channels are not grouped properly but shown in generic groups like 'other'
Channels are grouped based on the device mapping from the configuration file (see AppOnCallDutyInfoDigitizerApp#A_device_is_missing_from_the_list ) or if available according to the type information from LSA. If the calls to LSA fail the app does not crash but groups the devices in the 'other' group. So check the logs for errors regarding LSA calls. An app restart should result in a proper grouping if the device mapping is configured or the information is available via LSA (preferred).Chain and beam process cannot be selected for a triggered channel
Context information is fetched after selecting a triggered channel using the LSA ContextService. So check the logs for errors regarding LSA calls. Context filtering is currently only available for triggered channels (Triggered in the name). (See this DigitizerDU2 issue with some relation to context filtering https://gitlab.com/al.schwinn/DigitizerClass2/-/issues/73)
An event is missing from the trigger event list
Specified by the measuring device, ask FEC (aschwinn) to change it's configuration but this requires a front end redeploy as far as I know. To check it's current capabilities see the parameterChannelConfigDAQ#triggerEvents
/common/usr/cscofe/bin/pdex GSCD002 ChannelConfigDAQ triggerEvents

NOMEN  = GSCD002 (DigitizerDU2.dal007 | DigitizerClass2)
TIMDOM = SIS18_RING (300)
|
ChannelConfigDAQ CTXT = 18:38:00.728300 (03.02.21)
|-- triggerEvents    =      | CMD_SEQ_START             | CMD_BEAM_INJECTION        | CMD_BEAM_EXTRACTION
|                      | CMD_START_ENERGY_RAMP     | CMD_CUSTOM_DIAG_1         | CMD_CUSTOM_DIAG_2
|                      | CMD_FG_START              | EVT_COMMAND
There is an error when opening the channel / subscription
Check the error message, maybe the client sample rate or trigger setting is not supported or has changed since the app start (not very likely). Restart in that case.Determine the measuring device
The measuring device might also be offline or in error condition. Make sure you have the real device name which must not be the one from the channel name but is printed in parenthesis after the channel or even in the error message. If there is no suffix you can assume the name in the channel. Here we can see two measuring devices that both measureGS11MU2 and provide channels to measure it's values. GSCD002 is a separate digitizer device – a picoscope.
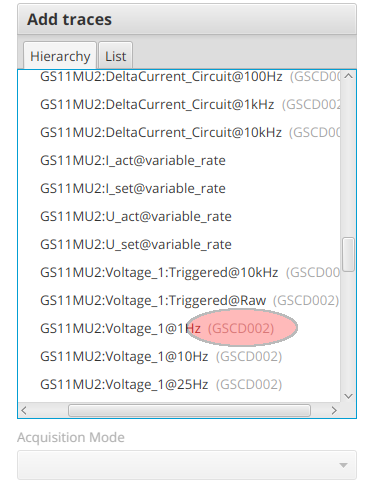 Using
Using pdex you can locate the SCU.
Do a manual subscription using fex
To debug the subscription to the device you can use fex. In our example from the screenshot above (GSCD002 with Channel GS11MU2:Voltage_1) we configure a streaming subscription like follows using the AcquisitionDAQ property:
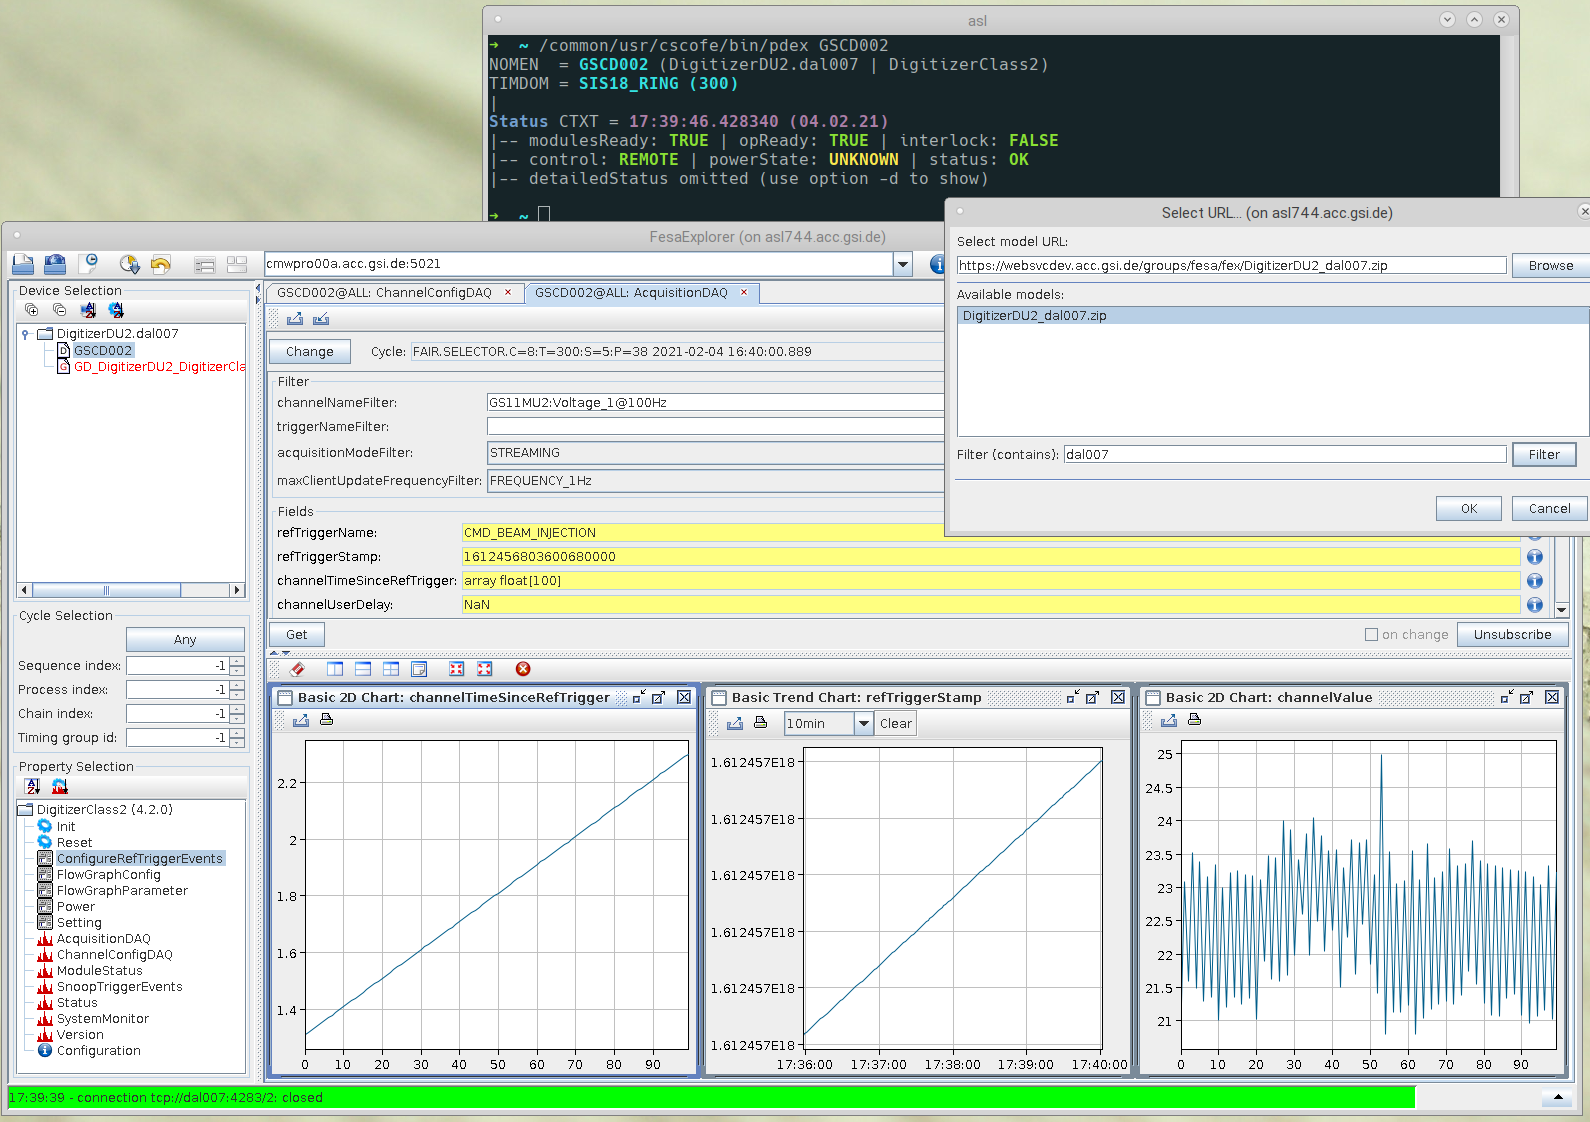 You can play with different Hz values. Best results using fex is when using a signal sample rate of about
 100Hz or 1kHz and a client update rate of 1Hz. (Otherwise you won't see much if you are only receiving 1 sample per update for example with 25Hz at 25Hz client rate …).
It is a good sign to receive any channelValues. But in the shown example we are only seeing noise – which might be okay depending on the situation.
Making sense of refTriggerSamp and channelTimeSinceRefTrigger is not so easy, because only combined they provide the information about the timestamp of the data (X-Axis). But skipped data can often be the result of "unreasonable" X-Axis information. It is better to debug this using the daq-dumper. See below AppOnCallDutyInfoDigitizerApp#I_need_a_list_of_the_send_data_in_order_to_debug_it.
For triggered channels (Triggered in the name) you have to enter a triggerNameFilter as String (Get the device's list from above AppOnCallDutyInfoDigitizerApp#An_event_is_missing_from_the_trigger_event_list) and set the acquisitionModeFilter to TRIGGERED.
Check if timing events are received
The digitizer devices (not PowerSupplies) have the propertySnoopTriggerEvents where you can see received events for debugging.
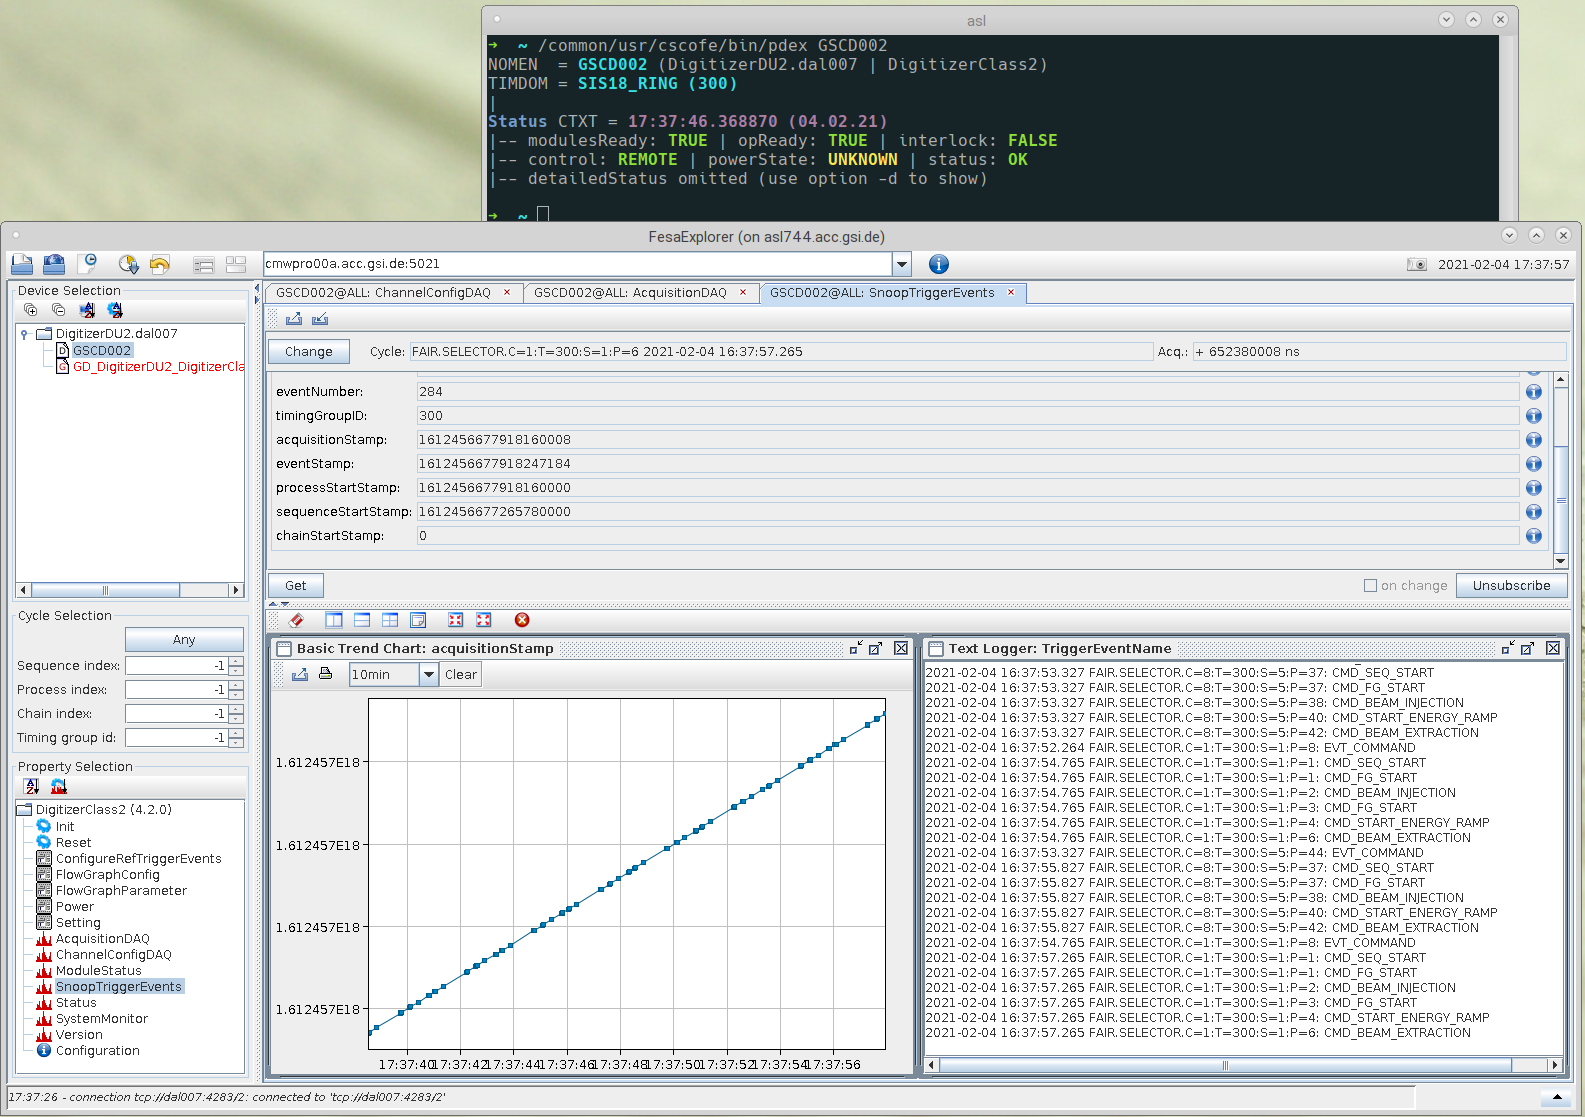
Check the configured trigger events
Digitizer devices have a set of events configured that will cause the frontend to record data. These might be missconfigured (but is not very likely). They are mostly configured with a "main" relevant timing event and some fallbacks likeSEQ_START.

The channel data is showing the wrong signals / measuring a different source
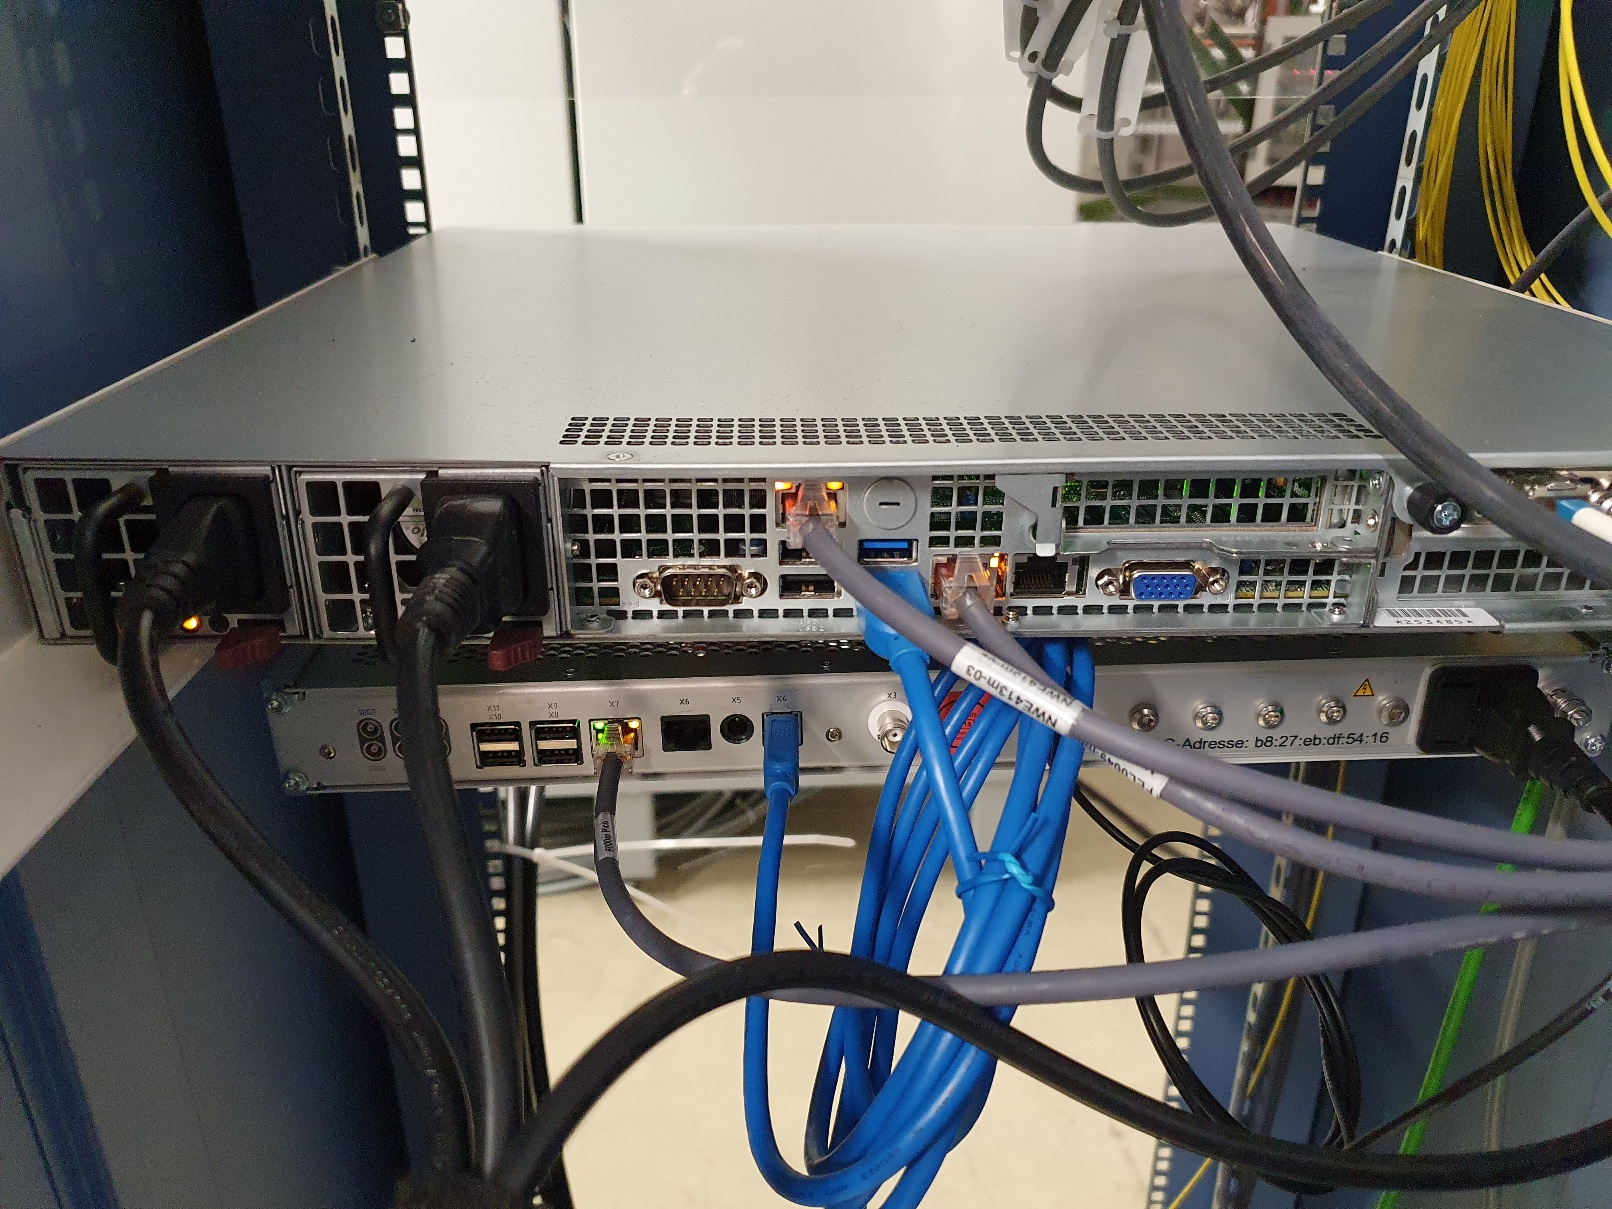
For digitizer devices this can can only be changed by plugging different cables into the digitizer by HW or the mashine experts and configuring the channel's properties in the digitizer software (rate, amplitude and how to downsample it) by FEC / aschwinn. Here is an informational picture of how the cabling might look like (Abbildung ähnlich ;-)):
The shown data has the wrong amplitude / value
The digitizer app does not modify received Y values. You could double check using a manual subscription using fex. Offset values or factors are applied in the digitizer frontends and PowerSupply DUs. You will most likely have to ask them for a correction. Missmatches are probable at this point.There is no data shown in the chart
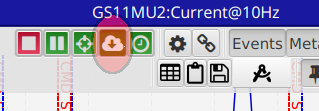
Is the data not visible in in the view window of the chart or has no data been sent? There is a marker if no data has been received yet after starting the chart: If there has been data received, it may be that the shown view window is just out of range. Try using the "view whole data set" mode temporarily to make sure we see the full picture. (The mode is usually only useful in full sequence or triggered mode)
 As mentioned above, test the measuring device's state. Is the measured device on? Especially relevant for reading actual values (not set).
Try a manual subscription to the data: AppOnCallDutyInfoDigitizerApp#Do_a_manual_subscription_using_fex
If the values are located at a wrong X value (time) check if the reference trigger timestamp value from the device is reasonable. Maybe a digitizer device reset helps.
When there has been maintenance period or no operation – meaning a longer period when no timing events have been sent – the digitizer devices will have a problem providing a reference trigger value. Unreasonable reference trigger values are also discarded to protect against bogus values. Look at the console output. Look at the timing events for the device and make sure there is a pattern running with events relevant for the device (See above about getting the device's config property).
The shown data has a lot of missing parts
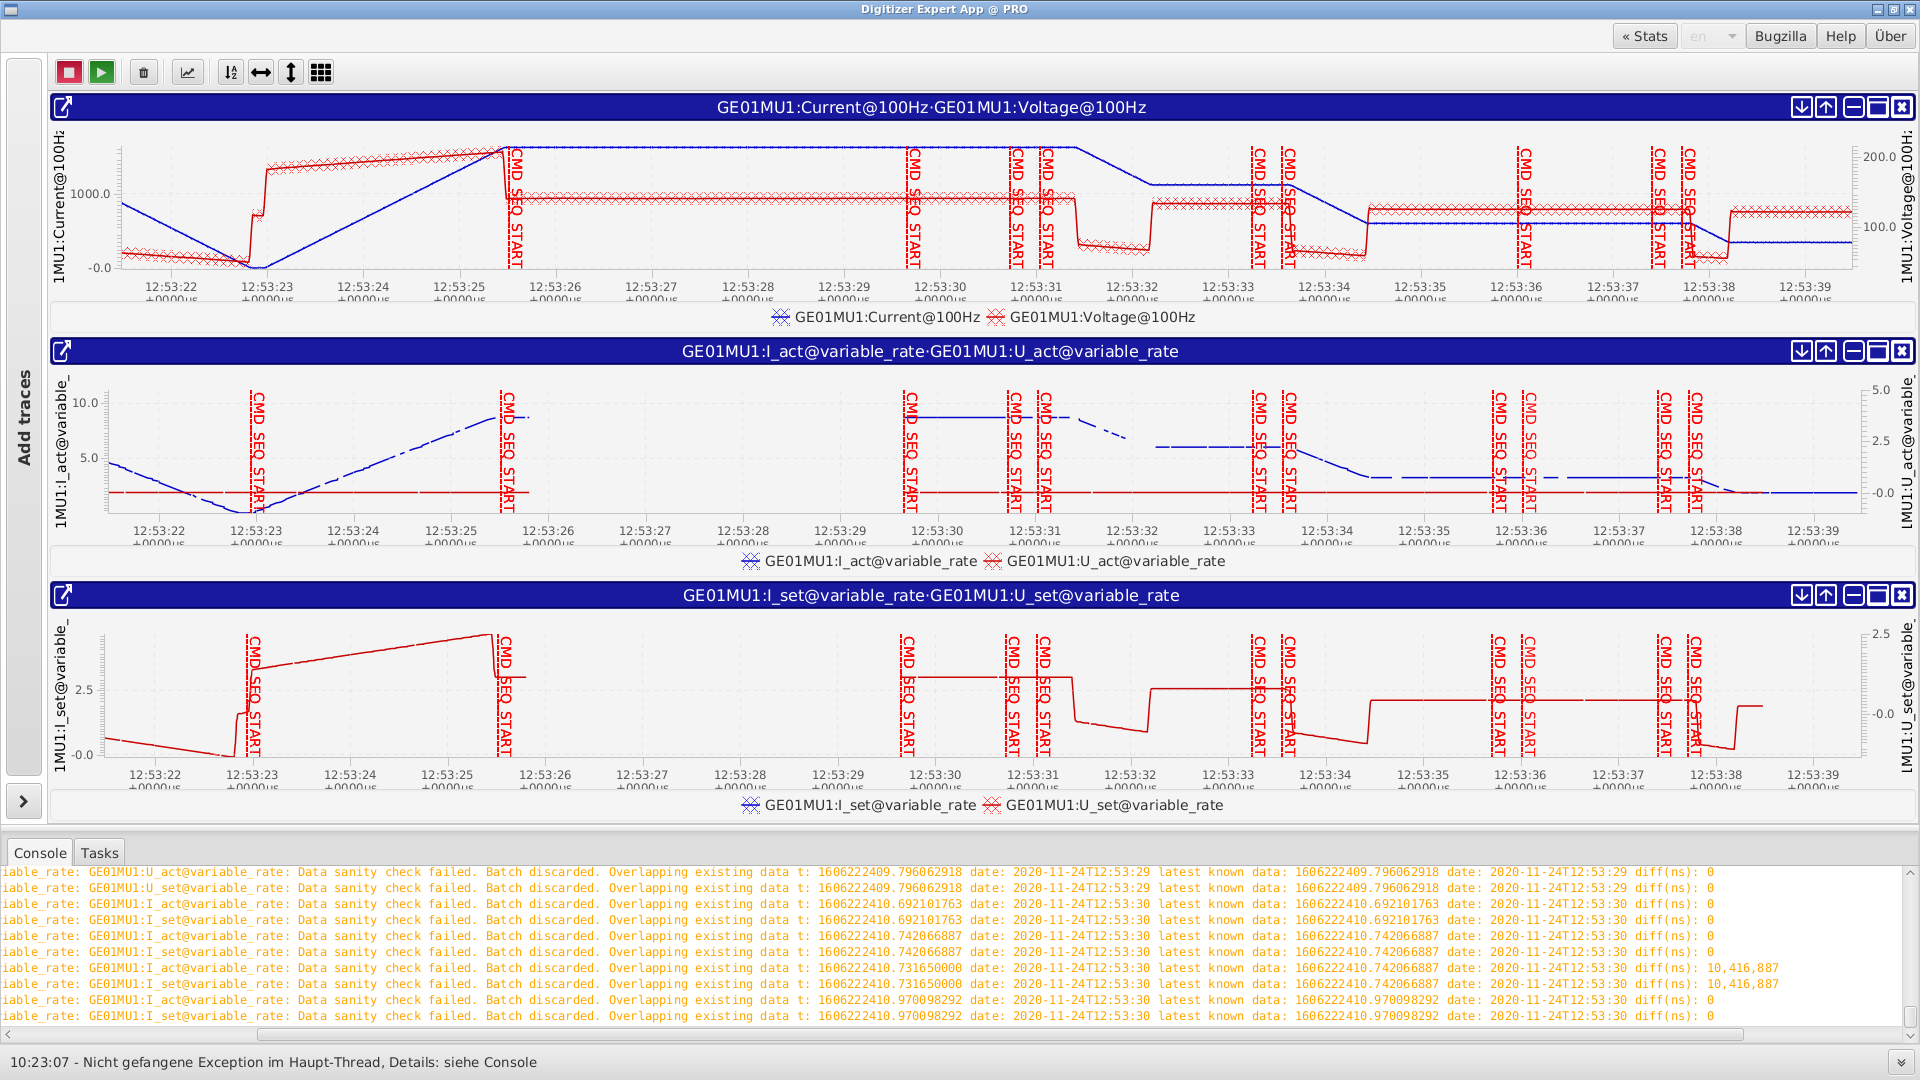
When the trace has gaps then data updates (batches with multiple measurement samples) had unreasonable content. It could also mean that the data is received repeatedly in an unexpected order. Look out for"Data sanity check failed" messages in the console log or Graylog.
The issues might most likely be located at the source, a reset / restart might help here in case of digitizer devices. I am not so sure about PowerSupplies they need to be started more carefully.In a hot fix situation it might be possible to disable the check by changing this method: AcquisitionDataSanityChecker#filterAndLogUnacceptable (permalink) to return
false.
There is also a bug in the front end's ring buffer code that will set an unexpected zero value when the next reference trigger changes (the trigger that is the base for all the timing information of a data update). This is most likely the cause for gaps. See https://gitlab.com/al.schwinn/lockfree-custom-fesa-cyclebuffer/-/issues/32 (As of 2021-02-04 this is investigated but not fixed or deployed)
Special for PowerSupplies (with MIL bus (currently the only ones with DAQ functionality)): Other reasons might be frontend devices with too much load on the interface MIL bus, a fix was to connect less devices to one interface card (hardware fix). Moreover measured ramp data is not available continuously. This means that more data updates are being sent when the ramp changes and will not send data for "straight lines". This might lead to longer missing parts even only one data update is lost or invalid.
The problem might look like this:
Full Sequence mode does not show the full pattern
Full sequence mode is currently not too helpful. It is simply providing the values from one SEQ_START to the next.The context can only be selected for triggered signals
Yes, currently a context filter can only be applied to triggered signals. According a aschwinn only here the filtering is supported by the devices at the moment. (2021-02-04)Known Bugs
There are known bugs for the digitizer app, have a look here: https://www-acc.gsi.de/bugzilla/buglist.cgi?component=Digitizer%20App%20Expert&list_id=9846&product=Applications&resolution=---Other problems regarding digitizer / DAQ devices
Digitizer frontend software might have a bug maybe also look into the open issues list for the symptoms you are seeing.- https://gitlab.com/al.schwinn/DigitizerClass2/-/issues
- https://gitlab.com/al.schwinn/lockfree-custom-fesa-cyclebuffer/-/issues (Used by both Digitizer and PowerSupply)
Inside the chart UI element something weird happens
Chart FX library is used for rendering the charts, maybe also look at their issue list: https://github.com/GSI-CS-CO/chart-fx/issuesI need a list of the sent data in order to debug it
Try thedaq-dumper. A command line tool that creates a subscription similar to the digitizer app using FESA / JAPC but allows to simply print a CSV file with some diagnostic information. There are also helper tools to display those values as a table or to plot them.
https://git.acc.gsi.de/bpeter/daq-dumper/src/branch/master/README.md Edit | Attach | Print version | History: r8 < r7 < r6 < r5 | Backlinks | View wiki text | Edit wiki text | More topic actions
Topic revision: r8 - 10 Nov 2023, BenjaminPeter
 Copyright © by the contributing authors. All material on this collaboration platform is the property of the contributing authors.
 Ideas, requests, problems regarding Foswiki? Send feedback


